Price
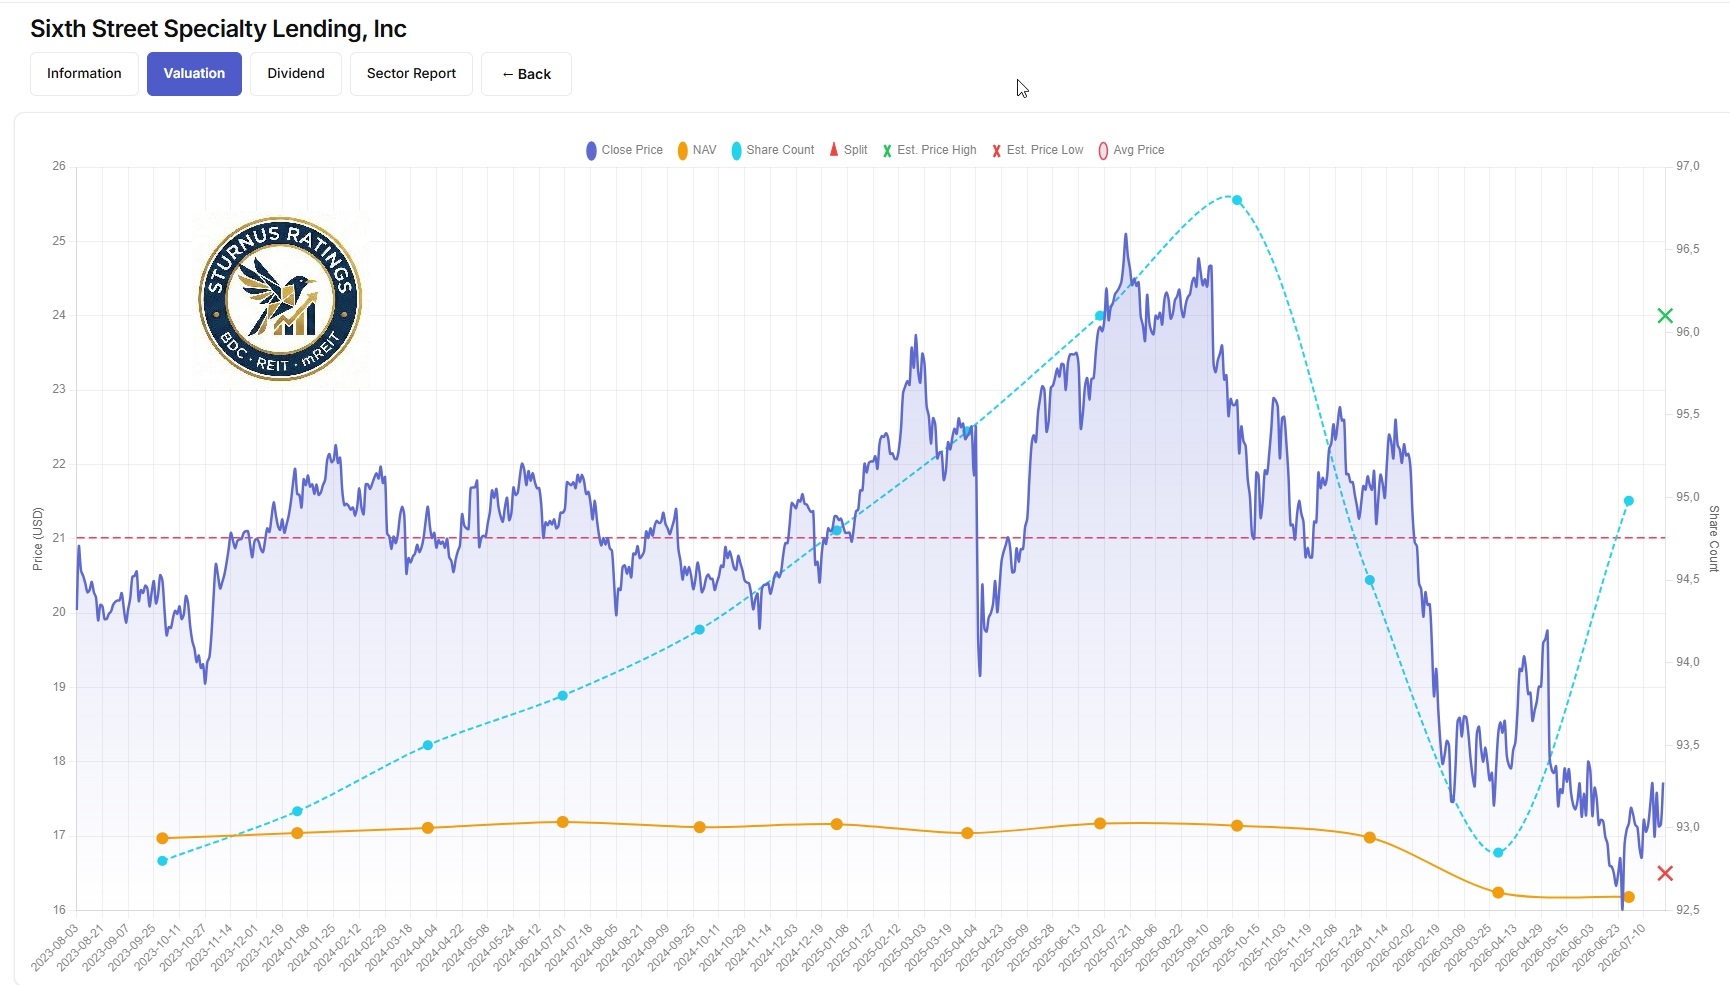
Sixth Street Specialty Lending, Inc. is one of the highest-quality publicly traded BDCs, but the investment case has become more complicated in 2026. The primary issue is not an obvious deterioration in credit quality. Instead, the company has experienced a combination of:
- declining interest-rate-driven earnings;
- a lower base dividend;
- NAV pressure from market-value movements;
- and a valuation that has historically reflected a premium for superior underwriting and credit performance.
The Q1 2026 results showed: NAV/share: $16.24 compared with: $16.98 at December 31, 2025 or: $16.97 on an adjusted basis after accounting for the Q4 supplemental dividend.
The principal driver of the NAV decline was: $0.58/share of fair-value movement attributable to market inputs. This is important because the decline was not primarily attributed to broad credit deterioration.
The current share-price valuation therefore needs to be interpreted through two separate lenses:
- Is the decline in NAV temporary market marking?
- Is TSLX's normalized earnings power declining permanently as rates fall?
Answer is: The first issue is likely cyclical; the second is structural but manageable.
Share price performance relative to NAV trends
The NAV trend was: PeriodNAV/shareQ4 2025 reported$16.98Q4 2025 adjusted$16.97Q1 2026$16.24
The decline was approximately: 4.3% from reported Q4 NAV
and: 4.3% from adjusted Q4 NAV. This is meaningful, but the composition matters.
Approximately: $0.58/share of the decline was attributed to fair-value changes from market inputs. That suggests the deterioration was not necessarily equivalent to a $0.58/share permanent impairment of portfolio credit quality. Nevertheless, investors should not dismiss fair-value losses completely.
For BDCs, market marks can remain temporary for several quarters, but they can also be an early warning that:
- EBITDA multiples are compressing;
- leverage is rising;
- borrower valuations are weakening;
- or refinancing conditions are deteriorating.
Therefore, Q2 2026 NAV is exceptionally important.
Price-to-NAV analysis
TSLX historically deserves a premium valuation because of:
- high-quality underwriting;
- strong credit performance;
- an internally managed structure;
- differentiated origination;
- strong historical NAV preservation;
- and the Sixth Street investment platform.
However, the premium has to be balanced against:
- falling base rates;
- lower NII;
- reduced dividend distributions;
- and potential mark-to-market pressure.
Based on the latest verified NAV of: $16.24/share the key valuation question is whether the market price remains sufficiently close to NAV to compensate investors for the lower forward earnings profile.
My preferred valuation framework for TSLX is:
- <0.90× NAV
- Deeply attractive
- 0.90–1.00× NAV
- Attractive
- 1.00–1.10× NAV
- Fairly valued
- 1.10–1.20× NAV
- Premium but defensible
- >1.20× NAV
Requires exceptional credit and earnings performance
TSLX should generally trade at a premium to average BDCs.
But the premium should be smaller when:
- interest rates are falling;
- NII is declining;
- and the base dividend is being reduced.
Comparison with historical valuation ranges
The market has historically rewarded TSLX with a premium because shareholders have received something that is difficult to replicate: high-quality credit performance with strong NAV preservation and attractive total returns. The company's Q1 2026 results, however, demonstrate why premium valuation should not be treated as permanent. The stock is particularly sensitive to the relationship between: NAV growth + dividend yield
and the premium paid for that NAV. If NAV is flat while earnings decline, a premium can compress. If NAV stabilizes while credit remains strong, the premium can recover. The key catalyst is therefore not simply higher NII.
It is: demonstrating that NAV pressure is temporary while maintaining superior credit quality.
Comparison with relevant BDC peers
The closest comparable publicly traded BDCs include:
- Ares Capital Corporation
- Main Street Capital Corporation
- Blue Owl Capital Corporation
- FS KKR Capital Corp.
- Blackstone Private Credit Fund
However, the comparison is not one-to-one.
TSLX is differentiated by:
- internal management;
- a highly institutional investment platform;
- significant direct origination;
- strong underwriting;
- and a long history of relatively strong shareholder returns.
Against Ares Capital Corporation, TSLX is smaller but has historically demonstrated strong NAV performance. Against Main Street Capital Corporation, TSLX offers a different portfolio and valuation profile; MAIN's internally managed structure and equity-investment component make it a unique peer. Against externally managed BDCs, TSLX generally deserves a structural premium because shareholders do not bear the same external-management fee structure.
Conclusion is: TSLX remains a high-quality BDC, but its valuation premium should be lower than during periods of rapidly rising short-term interest rates.
Market sentiment and investor expectations
The market's expectations entering the Q2 release appear relatively cautious.
The company had already reduced its base dividend to: $0.42/share for Q2 2026 from $0.46/share for Q1 2026. The reduction reflects a changing earnings environment rather than an obvious credit crisis.
The Q1 results reported: NII/share of $0.42 which exactly matched the new Q2 base dividend. This means the dividend was covered by Q1 NII, but with essentially no excess coverage. That is a major change from the environment in which TSLX was able to pay substantial supplemental dividends.
The market is therefore likely asking: Has TSLX entered a permanently lower earnings regime, or is this simply the bottom of the interest-rate cycle?
The answer will depend heavily on:
- the Fed;
- SOFR;
- portfolio growth;
- new investment spreads;
- fee income;
- and credit performance.
Key catalysts affecting share price performance
Positive catalysts
- Stable or rising NAV.
- Continued low non-accrual levels.
- Strong portfolio-company EBITDA growth.
- Attractive new investment spreads.
- Successful deployment of capital.
- Recovery in market valuations.
- Resumption of supplemental dividends.
- Stabilization or increase in short-term rates.
Negative catalysts
- Further NAV declines.
- Rising non-accruals.
- Permanent impairment of investments.
- Continued decline in SOFR.
- Compression in portfolio yields.
- Further reduction in the base dividend.
- Excessive premium to NAV.
Dividend
TSLX declared a: $0.42/share base dividend for Q2 2026.
Annualized: $1.68/share
The Q1 2026 dividend was: $0.46/share.
Therefore, the annualized base dividend has declined from: $1.84 to: $1.68
This represents a reduction of approximately: 8.7%.
The yield investors should use is therefore based on: $1.68 annualized base dividend rather than the higher historical dividend level. The important distinction is that TSLX has historically paid supplemental dividends when earnings exceeded the base distribution. The current earnings environment provides much less room for that.
Regular, supplemental and special dividend history
TSLX's dividend model has historically consisted of:
- a base dividend;
- supplemental dividends when excess taxable income justified them.
The Q1 2026 results represented an important change: The base dividend was reduced from $0.46 to $0.42/share. At the same time, the company did not declare a supplemental dividend for Q2.
This is a clear indication that management is prioritizing: NAV preservation and sustainable distributions over maintaining a high headline payout. I view this positively from a long-term perspective. A BDC that pays out excess income too aggressively can eventually erode NAV. TSLX's approach is more conservative.
NII and Adjusted NII coverage analysis
Q1 2026: NII/share = $0.42
Q2 base dividend: $0.42/share
Therefore: NII coverage = approximately 100% on the latest verified quarterly figures. This is acceptable but not generous.
The lack of a coverage cushion means that:
- further rate cuts;
- lower portfolio yields;
- higher funding costs;
- or weaker investment income
could create pressure.
However, TSLX has historically demonstrated strong earnings management and portfolio selection. The key question for Q2 is whether NII remains around: $0.42/share or moves below that level.
Dividend payout ratio
Using Q1 NII: $0.42 dividend ÷ $0.42 NII gives: 100% payout ratio This is higher than I would prefer for a BDC. A sustainable long-term target would ideally be: 90–95% of recurring NII with some flexibility depending on realized taxable income. Therefore, TSLX's current dividend policy is: sustainable but not comfortably covered. This is a major reason why the supplemental dividend has disappeared.
Spillover income analysis
TSLX's management has historically been cautious about distributing accumulated spillover income too aggressively. This is a strength. Rather than treating spillover as permanent recurring earnings, management has generally emphasized the importance of preserving NAV. The result is that TSLX should not be evaluated based on a temporary high distribution yield. Instead: The $0.42 base dividend should be viewed as the current recurring distribution benchmark. Any supplemental distribution should be treated as additional upside rather than a permanent component of yield.
Assessment of dividend safety and sustainability
My rating:
Dividend safety: GOOD
Dividend coverage: ADEQUATE
Dividend growth: CURRENTLY WEAK
I do not view the dividend as being at immediate risk of a major cut. The reduction from $0.46 to $0.42 was itself a proactive adjustment. The greater risk is: another gradual reduction if short-term rates fall significantly.
The company's dividend is therefore safer than the current coverage ratio alone might suggest because of:
- high-quality portfolio construction;
- strong historical credit performance;
- liquidity;
- and management's willingness to adjust the payout.
Potential catalysts for dividend increases or reductions
Potential increases
- Higher short-term rates.
- Portfolio growth.
- Increased investment yields.
- Lower funding costs.
- Strong realized gains.
- Greater excess taxable income.
- Recovery in NAV.
Potential reductions
- Additional Fed rate cuts.
- Falling portfolio yields.
- Higher non-accruals.
- Credit losses.
- Further NAV erosion.
- Reduced fee income.
Management's dividend outlook
The most important message from management is that TSLX appears willing to: prioritize long-term NAV preservation over maximizing near-term distributions.
I consider this a positive. The $0.42 base dividend should be regarded as the current sustainable baseline. I would not forecast a return to: $0.46/share until earnings clearly recover.
Valuation
Using the latest verified NAV: $16.24/share the valuation should be calculated using the current market price at the time of the Q2 release. Because the Q2 report has not yet been publicly verified in the available sources, I will not manufacture a precise Q2 P/NAV ratio. The correct formula is: Current share price ÷ Q2 2026 NAV/share. This should be recalculated immediately after the Q2 report.
The key valuation principle remains: TSLX deserves a premium to NAV, but the premium should reflect current earnings power rather than historical peak earnings.
Historical Price-to-NAV comparison
TSLX has historically traded at a premium because investors have rewarded:
- NAV preservation;
- strong credit;
- internal management;
- and attractive risk-adjusted total returns.
However, the appropriate premium has changed as the interest-rate cycle has changed. In my view, the market should not pay the same premium for: $0.42/share quarterly NII as it previously paid for a materially higher earnings run-rate. The premium should therefore be based on: normalized through-cycle NII rather than trailing peak NII.
NAV Per Share trend analysis
The latest verified NAV trajectory is: $16.98 → $16.24 from Q4 2025 to Q1 2026. The decline was primarily driven by: fair-value changes from market inputs rather than a reported broad-based credit deterioration. This is important. If Q2 NAV stabilizes, I would regard the Q1 decline as largely cyclical. If Q2 NAV declines again materially, the investment thesis becomes more complicated.
Net Investment Income trend analysis
The most recent verified NII: $0.42/share
was sufficient to cover the new: $0.42/share base dividend. However, earnings have clearly moved lower as the benefit from high short-term interest rates has diminished. This is the central structural issue for TSLX.
A significant portion of BDC earnings is linked to: floating-rate assets while funding costs also move with rates.
The net effect depends on:
- asset repricing;
- liability repricing;
- hedging;
- leverage;
- and portfolio turnover.
TSLX's earnings decline is therefore not necessarily permanent. But investors should assume that: the era of exceptionally high NII created by elevated short-term rates is over unless rates stabilize or rise again.
Portfolio yield and earnings quality assessment
TSLX's portfolio is primarily focused on:
- first-lien debt;
- senior secured lending;
- sponsor-backed middle-market companies.
This produces higher-quality recurring earnings than the venture-debt model of Horizon Technology Finance Corporation. The key positive is: TSLX's earnings are predominantly generated from contractual cash-pay credit investments.
This generally produces better earnings quality than BDCs that rely heavily on:
- PIK interest;
- equity appreciation;
- or venture warrants.
Therefore, even though NII is declining, I view its underlying quality as: High.
Non-Accrual analysis and credit quality evaluation
This is where TSLX continues to distinguish itself.
The Q1 2026 NAV decline was attributed primarily to market-input marks rather than an announced broad-based credit deterioration.
Historically, TSLX has maintained low non-accrual levels compared with many BDC peers.
That is a major reason the company deserves a premium valuation.
The key Q2 metrics I would watch are:
- non-accrual at cost;
- non-accrual at fair value;
- percentage of portfolio on non-accrual;
- internal risk-rating migration;
- weighted-average EBITDA growth;
- realized losses.
The critical distinction is: A market mark is not necessarily a credit loss.
But: A migration to non-accrual is a much stronger negative signal. Therefore, if Q2 confirms stable non-accruals despite the NAV pressure, I would consider that a positive development.
Portfolio composition and diversification analysis
TSLX's core strength is its focus on:
upper-middle-market and middle-market sponsor-backed companies
with an emphasis on:
first-lien senior secured loans.
This is fundamentally different from:
- HRZN's venture lending;
- TriplePoint Venture Growth BDC Corp.'s venture exposure;
- or BDCs with large second-lien/equity portfolios.
The portfolio is diversified across:
- industries;
- borrowers;
- sponsors.
This reduces idiosyncratic credit risk. The key risk is not usually one individual borrower. It is: a broad deterioration in the leveraged-credit cycle.
Leverage and balance sheet assessment
TSLX's leverage has historically been managed within a relatively disciplined range. The company has access to:
- unsecured debt;
- revolving credit facilities;
- and multiple funding sources.
The issuance of: $300 million of 5.650% unsecured notes due 2031 in May 2026 is particularly important. This extends the maturity profile and provides additional funding diversification. The 5.65% coupon is also attractive relative to the yield on many BDC liabilities.
The key benefit is: longer-duration fixed-rate funding
against: predominantly floating-rate assets.
However, when rates decline, asset yields can fall faster than fixed-rate funding costs. Therefore, this financing structure is positive for liquidity and maturity management but can create some near-term margin pressure during a falling-rate cycle.
Liquidity and debt maturity profile
Liquidity is a major strength.
TSLX has historically maintained:
- substantial revolver capacity;
- diversified unsecured notes;
- multiple maturity dates.
The May 2026 issuance of $300 million of 5.65% notes due 2031 further improves the maturity ladder.
This reduces: refinancing risk and gives the company greater flexibility to:
- fund portfolio investments;
- repay maturing debt;
- and manage market volatility.
I consider TSLX's balance sheet: strong.
Impact of Federal Reserve policy and macroeconomic conditions
TSLX is highly sensitive to Fed policy.
Falling rates:
Negative for NII
because floating-rate asset yields decline.
Falling rates:
Potentially positive for credit quality
because portfolio companies benefit from lower interest expense.
Falling rates:
Potentially positive for valuation
because lower risk-free yields can increase demand for credit assets.
Higher rates:
Positive for NII
but potentially negative for:
- borrower interest coverage;
- EBITDA;
- and credit quality.
TSLX therefore faces a trade-off. I believe the optimal environment is: moderate rates + stable economic growth + low defaults.
That environment would allow:
- strong portfolio-company performance;
- healthy NII;
- and low credit losses.
Relative valuation versus peer BDCs
TSLX deserves to trade at a premium to:
- lower-quality externally managed BDCs;
- BDCs with high non-accruals;
- BDCs with weak NAV histories;
- and BDCs heavily dependent on PIK income.
The question is whether it deserves the same premium as:
- Main Street Capital Corporation;
- Ares Capital Corporation;
- or other top-tier BDCs.
My answer is: Yes, but the premium should be moderate rather than extreme.
TSLX has one of the strongest combinations of: credit quality + internal management + direct origination + NAV performance in the BDC universe.
However, the current lower earnings environment means the stock should be valued primarily on: through-cycle returns rather than peak-rate earnings.
Assessment
Based on the latest verified information: TSLX is fundamentally high quality, but the valuation should be judged against the post-rate-cut earnings regime.
I would classify the stock as: Fairly valued to moderately undervalued if trading around: 1.0–1.1× NAV
and: Attractive below: 1.0× NAV.
A premium above: 1.15–1.20× NAV would require:
- stable NAV;
- low non-accruals;
- and evidence that NII has bottomed.
The most important data point from Q2 will therefore be: NAV/share + NII/share + non-accruals as a three-part combination.
Conclusion
1. High-quality credit platform
TSLX is one of the better-underwritten publicly traded BDCs.
2. Strong NAV history
Long-term NAV preservation remains a major competitive advantage.
3. Internal management
This creates better shareholder alignment and avoids the structural fee burden of externally managed BDCs.
4. High-quality portfolio
The focus on senior secured, sponsor-backed lending supports credit quality.
5. Strong liquidity
The company has diversified funding sources and recently added $300 million of 5.65% unsecured notes due 2031.
6. Strong dividend culture
Although the dividend has been reduced, management appears willing to prioritize sustainability over artificially maintaining a high payout.
Summary of key risks
1. Falling NII
The biggest near-term risk is lower earnings from declining short-term rates.
2. Reduced base dividend
The base dividend declined from $0.46 to $0.42/share.
3. NAV volatility
Q1 NAV declined approximately 4.3%.
4. Market valuation
A premium to NAV creates downside if investor sentiment toward BDCs weakens.
5. Credit-cycle risk
Even high-quality BDCs eventually experience credit losses.
6. Limited dividend coverage cushion
The latest verified NII/share was approximately equal to the base dividend.
Outlook for NAV and Net Investment Income
NAV:
Moderately positive over the long term, but volatile near term. The Q1 decline was primarily market-input related. If Q2 confirms stable credit quality, I would expect NAV to stabilize.
NII:
- Near-term: flat to slightly lower
- Long-term: dependent on Fed policy and portfolio growth
The biggest challenge is replacing the earnings lost from lower base rates. TSLX can offset some of this through:
- portfolio growth;
- attractive new investments;
- fee income;
- and lower funding costs.
But I would not expect NII to return rapidly to the peak levels seen during the highest-rate environment.
Outlook for dividend sustainability
Positive, but with lower growth potential.
I believe the $0.42 base dividend is sustainable under a normal economic environment. The more important question is whether TSLX can eventually generate enough excess income to resume supplemental dividends. I would not expect significant supplemental dividends until: NII consistently exceeds the base dividend.
Assessment of portfolio credit quality
Strong
This remains my central reason for maintaining a favorable view of TSLX.
The Q1 NAV decline was primarily linked to market-input movements rather than a reported systemic credit deterioration.
If Q2 shows:
- low non-accruals;
- stable risk ratings;
- and limited realized losses,
then the current NAV pressure should be considered primarily cyclical.
Expected impact of management guidance and Federal Reserve policy
TSLX is entering a more difficult environment than during the peak of the rate cycle.
The Fed's policy path will influence:
- portfolio yields;
- borrower interest expense;
- NII;
- dividend coverage;
- and NAV.
I believe management's decision to reduce the base dividend rather than distribute excess capital is prudent. The company appears to be positioning itself for: a lower-rate environment with a stronger balance sheet and more conservative distribution policy. This should support long-term NAV preservation.
Final Investment Thesis
Sixth Street Specialty Lending, Inc. remains one of the highest-quality BDCs, but investors should no longer value it as though the peak-rate earnings environment will persist indefinitely. The Q1 2026 results demonstrated this transition clearly. NAV declined from: $16.98 to $16.24 while NII was: $0.42/share and the Q2 base dividend was reduced to: $0.42/share. This is not a broken investment thesis. It is a transition from: high-rate, high-distribution BDC to: high-quality, lower-yielding, NAV-focused BDC. That distinction is important.
I would rather own TSLX at a reasonable valuation with:
- 100% NII coverage;
- low non-accruals;
- strong underwriting;
- internal management;
- and a diversified funding structure
than a higher-yielding BDC with:
- weak credit quality;
- falling NAV;
- high non-accruals;
- and aggressive leverage.
The key question after Q2 2026 is therefore not whether TSLX's dividend yield is high enough. It is: Can Sixth Street Specialty Lending, Inc. preserve NAV and maintain NII around the $0.42/share level while the Fed moves toward lower rates? If the answer is yes, the company should continue to deserve a premium valuation. If NAV stabilizes and NII remains at or above $0.42/share, I would view any valuation around 1.0× NAV or below as an attractive long-term entry point. If the stock trades substantially above 1.15–1.20× NAV, however, I would be more cautious because investors would be paying a significant premium while receiving a materially lower dividend than during the peak earnings cycle.
Comments (0)
Log in to leave a comment.
No comments yet. Be the first to comment!