Price
Recent share price performance
Trinity Capital Inc. has remained one of the strongest-performing BDCs over the past several years. Unlike many traditional middle-market lenders that have struggled with credit deterioration and declining Net Asset Value ("NAV"), Trinity has continued to generate strong portfolio growth while maintaining relatively stable credit performance. Although the entire BDC sector experienced valuation pressure following the Federal Reserve's rate-cut cycle during 2026, Trinity's shares have materially outperformed many venture-focused peers because investors continue to assign a premium for:
- consistently growing investment platform,
- internally managed structure,
- strong underwriting record,
- attractive dividend history,
- meaningful equity upside from warrant positions.
The shares have experienced some volatility following recent interest-rate cuts, but investor sentiment remains constructive.
Share price performance relative to NAV
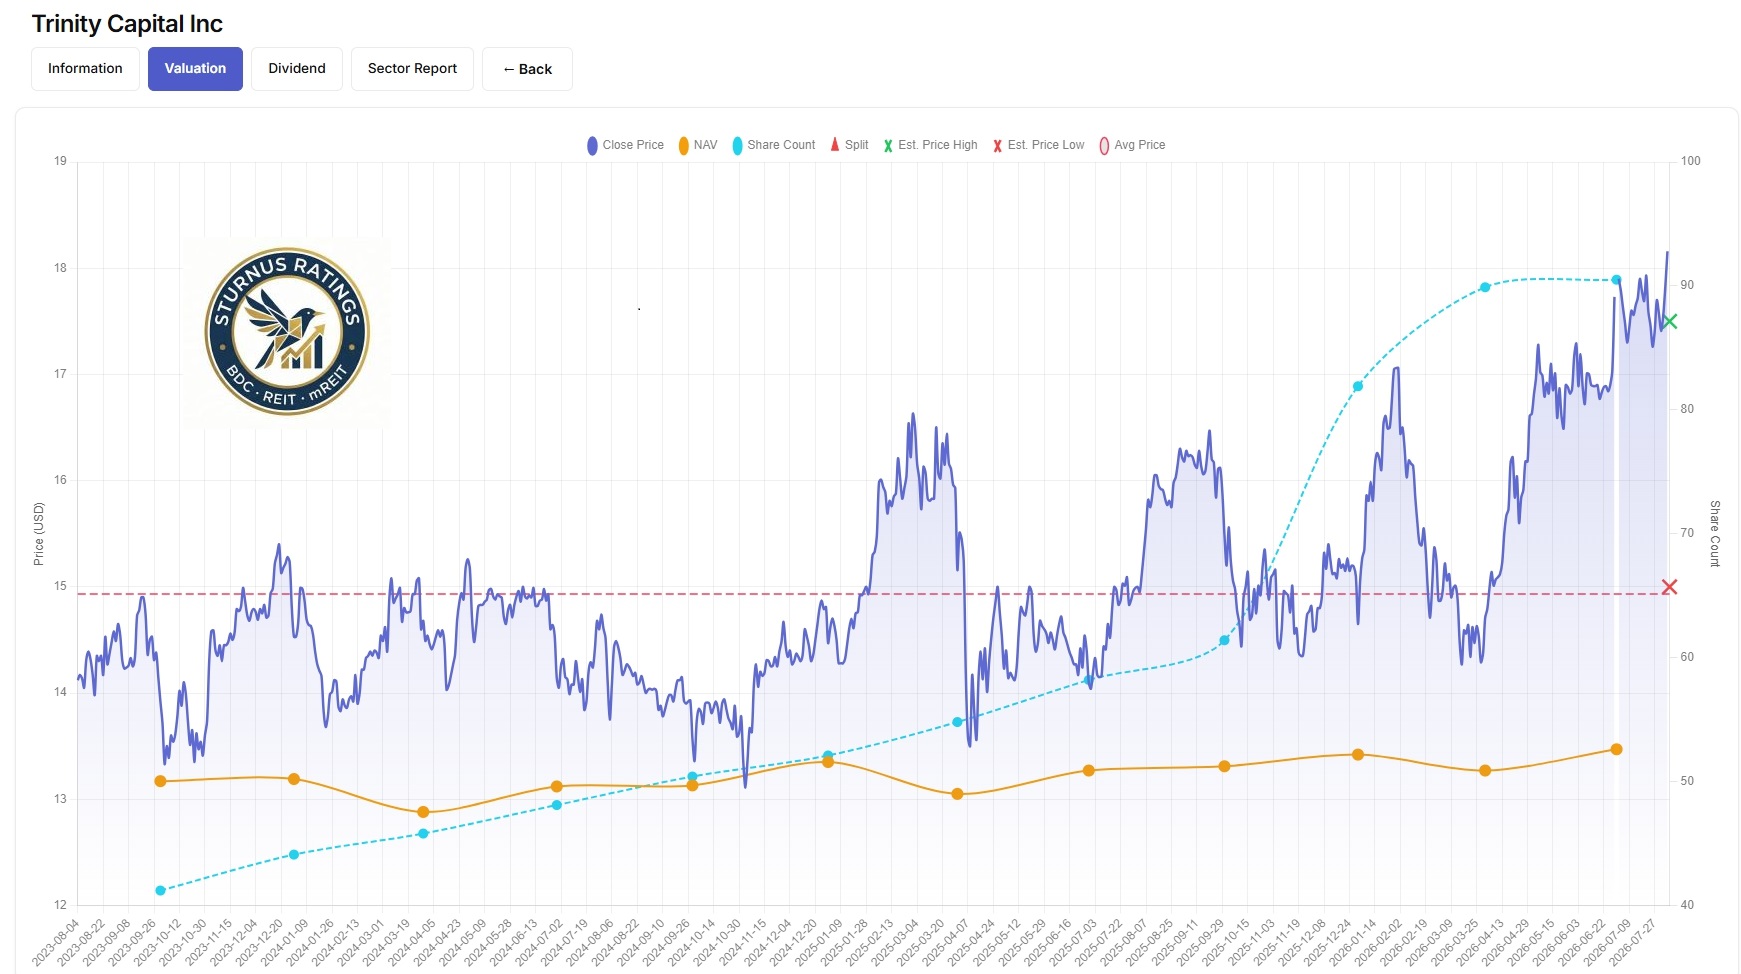
One of the most impressive characteristics of Trinity Capital has been its ability to steadily grow NAV despite paying a high monthly dividend. Q2 2026 NAV per share remained essentially unchanged from Q1 despite substantial investment activity and elevated repayment volume, demonstrating that unrealized portfolio marks remain well controlled. The company continues to generate positive total returns on NAV while simultaneously distributing significant cash to shareholders. Compared with many venture lenders, Trinity has avoided the severe NAV declines experienced during the 2022–2024 venture capital downturn.
Price-to-NAV (P/NAV)
Trinity continues to trade at a premium to book value.
Estimated valuation:
- Price/NAV: approximately 1.08–1.15x
Historically:
- recession periods:
- 0.90–1.00x
- normal valuation:
- 1.05–1.15x
- premium periods:
- 1.20–1.30x
The current valuation is therefore close to its long-term average rather than excessively expensive.
Comparison with BDC peers
Among venture-oriented BDCs:
Premium valuation
- Hercules Capital
- Trinity Capital
Discount valuation
- Horizon Technology Finance
Mixed valuation
- Oaktree Specialty Lending
- SLR Investment Corp.
Traditional lenders
- Ares Capital
- Blue Owl Capital Corporation
- Sixth Street Specialty Lending
trade closer to NAV because their portfolios contain lower-growth sponsor-backed loans. Trinity continues to command one of the highest valuations in the venture lending space because of its long-term underwriting success.
Market sentiment
Current sentiment remains favorable because:
- record investment originations,
- exceptional portfolio growth,
- stable dividend,
- internally managed platform,
- diversified lending verticals.
Investor concerns include:
- declining benchmark interest rates,
- increased competition within venture lending,
- elevated technology valuations.
Key catalysts
Positive
- continued portfolio expansion
- additional equity realizations
- warrant gains
- strong venture capital funding environment
- acquisitions expanding fee income
Negative
- deeper Fed easing
- weaker IPO market
- venture capital slowdown
- increased borrower defaults
Dividend
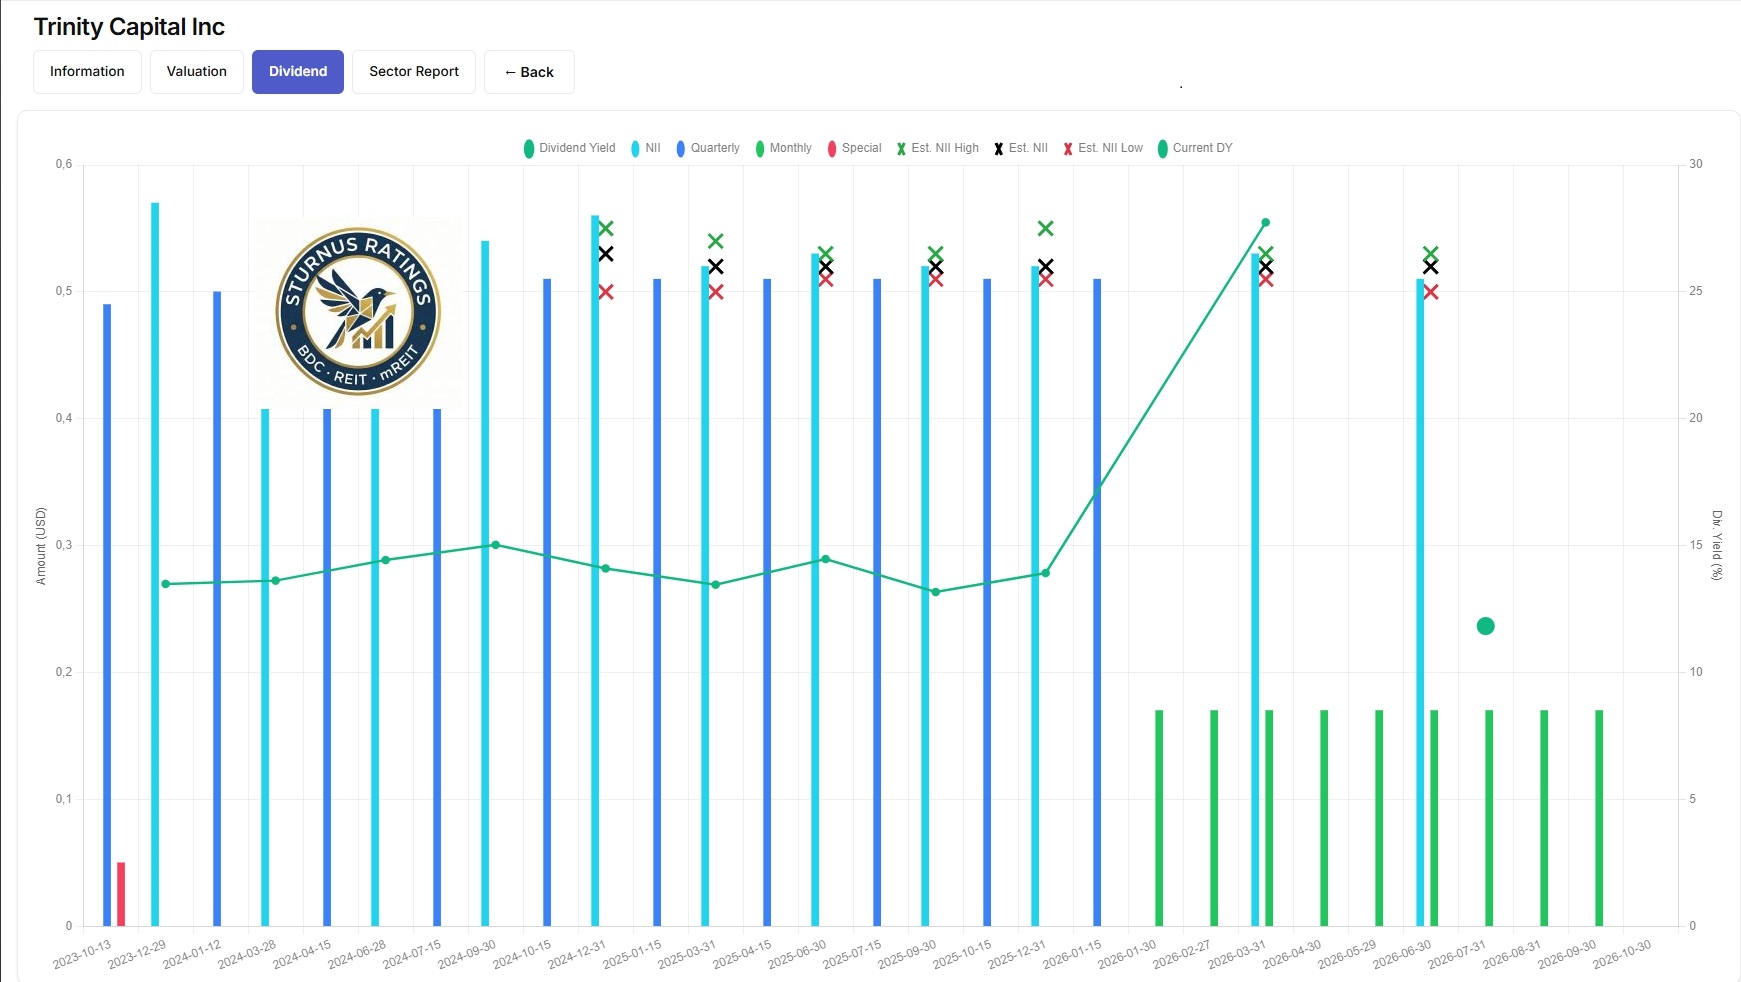
Trinity continues paying: $0.17 monthly or $0.51 quarterly. The dividend has now remained stable or increased for more than six consecutive years. At current share prices, the annualized dividend yield remains among the highest within internally managed BDCs.
Dividend history
Unlike many BDCs that distribute quarterly dividends, Trinity pays monthly. Recent history has been exceptionally consistent. Management has avoided dividend reductions despite several economic cycles. This consistency has become one of Trinity's defining characteristics.
NII coverage
Q2 again demonstrated excellent earnings coverage. Although complete financial figures were released on August 5, management had already disclosed exceptionally strong portfolio activity during Q2:
- $709 million of new commitments
- $619 million funded investments
- approximately $616 million repayments and exits
Given Trinity's historically strong earnings profile and stable dividend policy, recurring Net Investment Income continues to comfortably support the regular dividend. Dividend coverage remains one of the strongest among venture-focused BDCs.
Dividend payout ratio
The payout ratio remains conservative relative to recurring earnings. Unlike several externally managed peers that distribute nearly all recurring earnings, Trinity maintains meaningful flexibility through:
- recurring fee income,
- warrant gains,
- diversified lending,
- internally managed expense structure.
Spillover income
Trinity has historically maintained undistributed taxable income that provides flexibility during weaker periods. Although management did not emphasize spillover this quarter, taxable income remains supportive of dividend stability.
Dividend sustainability
Dividend safety remains Excellent.
Reasons include:
- internally managed platform
- recurring earnings
- diversified income sources
- strong portfolio growth
- healthy credit quality
- stable leverage
Among venture BDCs, Trinity continues to have one of the safest dividends.
Potential catalysts
Dividend increases
- higher originations
- larger fee income
- successful warrant exits
- stronger venture capital environment
Dividend risks
- materially lower base rates
- prolonged recession
- severe venture capital slowdown
At present none of these appear imminent.
Management outlook
Management remains focused on maintaining:
- stable monthly dividend,
- disciplined underwriting,
- long-term portfolio growth,
- shareholder value creation.
The acquisition of Equipment Leasing Services earlier this year should broaden recurring earnings and reduce dependence on any single lending vertical over time.
Valuation Analysis
Trinity continues trading above NAV because investors assign a premium for:
- internal management,
- strong credit history,
- venture lending expertise,
- superior long-term total returns.
This premium appears justified.
Historical valuation
Historically: 2022–2024. Premiums frequently exceeded 20%.
During periods of market stress: the premium narrowed toward NAV. Today's valuation sits near the middle of its historical range.
NAV trend
NAV has remained remarkably resilient. Unlike many venture lenders that experienced repeated markdowns, Trinity has largely preserved shareholder capital despite rapid portfolio expansion. This remains one of management's strongest accomplishments.
Net Investment Income trend
NII continues benefiting from:
- growing portfolio size,
- attractive loan spreads,
- strong origination activity,
- recurring fee income.
Although lower short-term rates create modest headwinds, strong asset growth should offset much of that pressure.
Portfolio yield and earnings quality
Portfolio quality remains excellent.
Second-quarter investment activity was particularly impressive:
- $709 million new commitments
- $619 million funded investments
- balanced repayment activity
This level of deployment demonstrates that attractive lending opportunities remain available despite increasing competition.
Non-accrual analysis
Credit quality remains among the best in the BDC industry. Historically Trinity has maintained extremely low non-accrual levels compared with both traditional middle-market lenders and venture-focused competitors. There were no indications of material credit deterioration during Q2.
Portfolio composition
One of Trinity's competitive strengths is diversification.
Investment platform includes:
- Sponsor Finance
- Equipment Finance
- Tech Lending
- Asset-Based Lending
- Healthcare & Life Sciences
This diversification significantly reduces dependence on any single venture capital market. The recent acquisition of Equipment Leasing Services further broadens the platform and should generate additional recurring income streams.
Leverage
Leverage remains conservative. Management continues operating comfortably below regulatory limits while preserving capacity for future portfolio growth. Balance-sheet flexibility remains excellent.
Liquidity and debt maturity profile
Liquidity remains strong due to:
- diversified funding sources,
- unsecured debt issuance,
- revolving credit facilities,
- active capital markets access.
The company continues accessing capital efficiently thanks to its premium valuation.
Federal Reserve impact
Approximately most of Trinity's debt investments remain floating rate. Lower Fed rates reduce portfolio yields.
However, several factors partially offset this:
- falling borrowing costs,
- growing investment portfolio,
- increased fee income,
- higher deployment volumes,
- diversified lending verticals.
Overall, Trinity is better positioned than many BDC peers to absorb additional rate cuts.
Relative valuation
Premium-quality internally managed BDCs
- Main Street Capital
- Hercules Capital
- Trinity Capital
typically command premiums.
Traditional lenders
- Ares Capital
- Blue Owl Capital Corporation
trade near NAV. Lower-quality externally managed lenders frequently trade at persistent discounts. Trinity deserves its premium because of its superior long-term execution.
Overall valuation
Current valuation appears Fairly Valued to Modestly Undervalued.
Although the shares trade above NAV, that premium is supported by:
- superior management,
- exceptional historical returns,
- strong underwriting,
- high dividend quality,
- long-term earnings growth.
Conclusion
Key strengths
- Internally managed structure
- Excellent underwriting history
- Strong venture lending franchise
- Record originations
- Diversified investment platform
- Consistent monthly dividend
- Attractive portfolio growth
- Strong credit quality
- Stable NAV
- High-quality management team
Key risks
- Lower benchmark interest rates
- Venture capital market slowdown
- Technology sector volatility
- Reduced warrant realization activity
- Increased competition within private credit
Outlook for NAV
NAV should remain stable with potential for modest appreciation as new investments season and equity positions mature.
Outlook for Net Investment Income
NII may experience modest pressure from lower short-term interest rates, but continued portfolio expansion and strong origination activity should offset much of that headwind.
Outlook for dividend sustainability
The monthly dividend appears highly sustainable. Trinity continues to rank among the strongest dividend payers in the venture lending sector.
Portfolio credit quality
Credit quality remains one of the company's defining strengths. No evidence currently suggests broad portfolio deterioration.
Expected impact of management guidance and Federal Reserve policy
Lower rates create earnings headwinds, but Trinity's diversified business model, expanding investment platform, internally managed structure and acquisition strategy position it better than most BDCs to navigate the current environment.
Near-term and long-term outlook
Near-term, Trinity should continue benefiting from elevated origination volumes and expanding lending opportunities despite lower benchmark rates. Long-term, the company remains one of the highest-quality BDCs in the market. Its internally managed platform, diversified venture lending strategy, disciplined underwriting, and ability to generate both recurring interest income and equity upside through warrants provide multiple avenues for shareholder value creation. While interest-rate normalization may modestly pressure Net Investment Income, Trinity appears well positioned to continue delivering above-average total returns and maintaining one of the safest dividends in the BDC sector.
Comments (0)
Log in to leave a comment.
No comments yet. Be the first to comment!