Price
Mid-America Apartment Communities, Inc. is one of the largest publicly traded multifamily REITs in the United States, with a portfolio concentrated primarily in the Southeast and Sun Belt.
The investment thesis is fundamentally different from that of a coastal apartment REIT. MAA benefits from long-term population and employment migration toward the Southeast, relatively favorable demographic trends, and a large portfolio of relatively affordable apartments. However, the same Sun Belt markets that drove MAA's strong growth in 2021–2022 also attracted substantial new apartment construction. That supply wave has become the central issue for the stock.
My answer is yes over the long term, but probably with a slower recovery than investors might have expected several years ago.
Recent share price performance
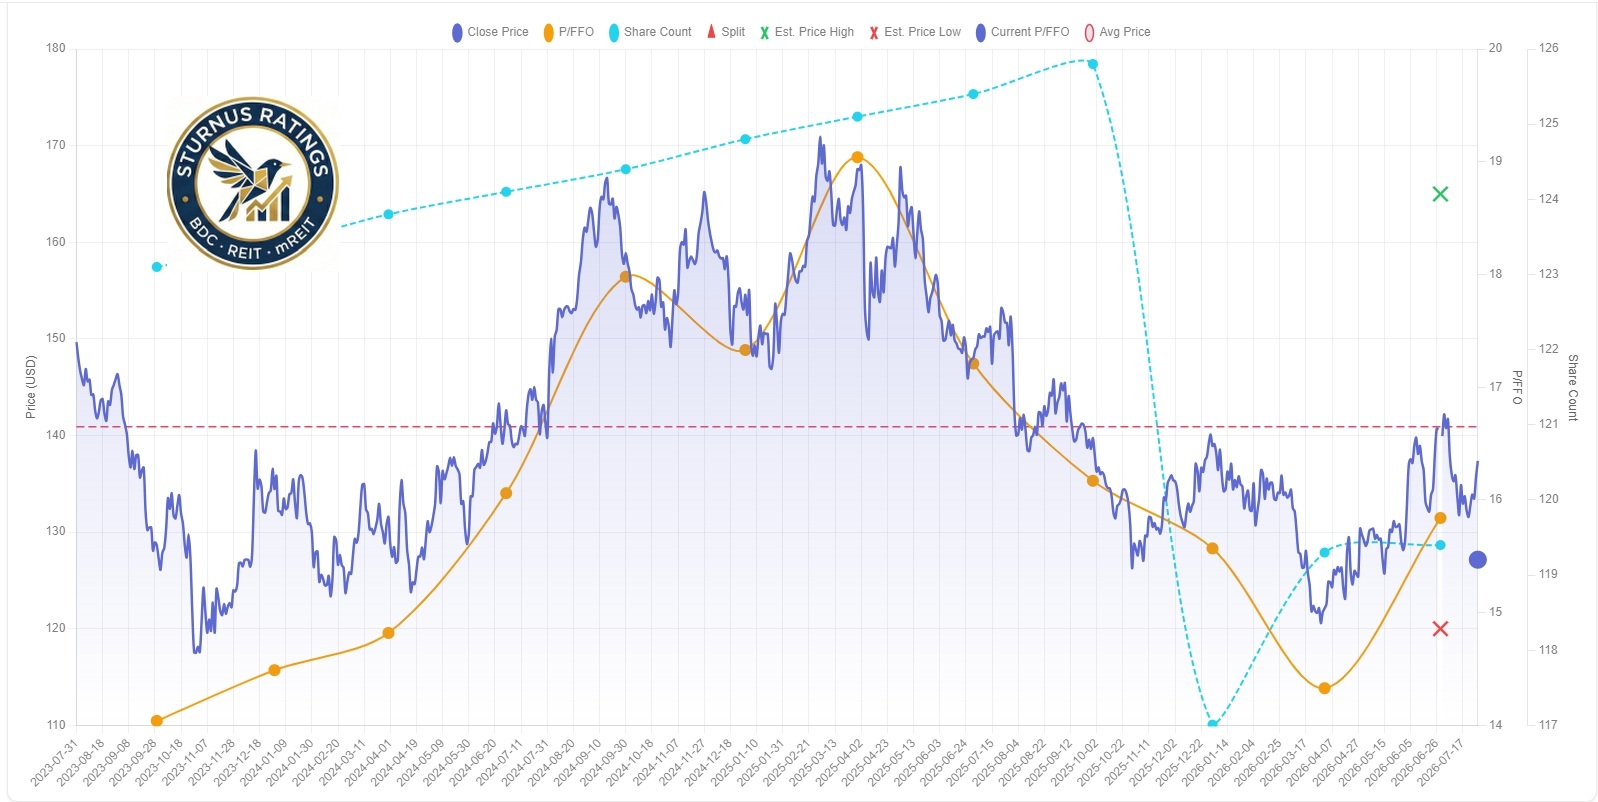
MAA closed at approximately $137.38 on July 29, 2026, after rising 1.28% during the session. However, the shares remained approximately 9.8% below their 52-week high of $152.36. This indicates that the market has already priced in a significant amount of the current Sun Belt weakness.
The stock is therefore in an interesting position:
- the operating fundamentals are not currently strong enough to justify an aggressive growth multiple;
- but the valuation is also no longer reflecting the extremely bullish Sun Belt growth expectations of the post-pandemic period.
The stock is essentially being valued on a normalization thesis.
Investors are betting that:
- new apartment supply will gradually be absorbed;
- rent growth will recover;
- MAA's strong balance sheet will allow it to continue developing attractive properties;
- and long-term population growth will eventually reassert itself.
I believe that thesis is reasonable, but the timing remains uncertain.
Q2 2026 results: the key development
The Q2 report provides a mixed but ultimately constructive picture. MAA declared its 130th consecutive quarterly common dividend, with the current annualized dividend rate at $6.12 per share. The company also reported Q2 Core FFO performance that exceeded expectations, although the updated 2026 outlook remains cautious on same-store NOI growth. This combination is important.
The business is currently benefiting from:
- strong occupancy;
- high resident retention;
- disciplined expense management;
- and continued development activity.
At the same time, the company faces:
- weak new-lease pricing;
- elevated apartment deliveries in certain markets;
- and pressure on same-store revenue growth.
The result is an unusual situation in which the balance sheet and operating platform are performing better than the headline rent-growth numbers suggest.
Key catalysts affecting the share price
1. Sun Belt apartment supply
This is the single most important catalyst. MAA's markets experienced significant multifamily construction following the pandemic-era population migration. New deliveries have temporarily increased competition for tenants.
This affects MAA in two ways:
- new lease pricing is pressured because renters have more choices;
- existing residents may receive more attractive offers from newly completed communities.
However, new supply is not permanent. Once the current construction pipeline is absorbed, the underlying demographic advantages of MAA's markets should become more important again. The crucial variable is therefore the duration of the supply overhang.
If supply absorption occurs faster than expected, MAA could experience a meaningful reacceleration in:
- blended lease growth;
- same-store revenue;
- same-store NOI;
- and Core FFO.
If supply remains elevated for several more years, the stock could remain range-bound despite strong occupancy.
2. Occupancy and resident retention
MAA's Q1 2026 results showed 95.5% average physical occupancy, while resident turnover was historically low at 39.9%. Blended effective lease-rate growth was -0.3%, but this represented a sequential improvement and reflected better new-lease and renewal pricing. This is one of the most encouraging aspects of the business. High retention is economically valuable because turnover is expensive.
When a resident renews:
- MAA avoids vacancy loss;
- avoids make-ready costs;
- avoids leasing commissions;
- and maintains stable occupancy.
Therefore, even if headline rent growth is weak, high retention can protect NOI margins. This is why I would not interpret weak new-lease pricing as evidence that MAA's business model is structurally impaired.
3. Development pipeline
MAA continues to have an important internal growth engine. As of Q1 2026, the company highlighted an approximately $1 billion development pipeline, with expected stabilized NOI yields of roughly 6.0%–6.5% on future starts. This is strategically important. MAA has historically been one of the better apartment REIT developers. The advantage of development is that management can create assets at a cost below the implied value of comparable stabilized properties. However, development also carries risk. If the company delivers a new property into a market experiencing excess supply, stabilization may take longer.
Therefore, I prefer MAA's development strategy when:
- land costs are reasonable;
- construction costs are controlled;
- and the expected stabilized yield comfortably exceeds the company's cost of capital.
At current interest rates, that spread needs to be monitored carefully.
4. Interest rates
Interest rates remain an important share-price catalyst. MAA's business is fundamentally defensive, but its valuation is sensitive to Treasury yields.
Lower long-term rates could:
- reduce the cost of debt;
- increase the value of apartment properties;
- improve development economics;
- support acquisition activity;
- and make the dividend more attractive.
Higher rates have the opposite effect. The positive factor is that MAA entered this period with a strong investment-grade balance sheet. At March 31, 2026, net debt was approximately $5.6 billion, total debt carried an average interest rate of approximately 3.9%, and approximately 87.1% of debt was fixed-rate. MAA also maintained investment-grade ratings of A-/A3. This substantially reduces the immediate impact of higher short-term interest rates.
Technical and fundamental sentiment
The current market sentiment toward MAA is best described as cautiously neutral.
The stock is well below its 52-week high but is not trading at a distressed valuation.
Fundamentally, the sentiment is being driven by the conflict between:
Positive:
- high occupancy;
- strong resident retention;
- favorable long-term Sun Belt demographics;
- strong balance sheet;
- development capabilities;
- and disciplined expense management.
Negative:
- weak rent growth;
- elevated new apartment supply;
- cautious 2026 NOI outlook;
- and uncertainty about the timing of a Sun Belt recovery.
The market is therefore waiting for evidence that same-store NOI growth has bottomed. I believe that is the single most important signal for a sustainable rerating of the stock.
Dividend
MAA's dividend is one of the strongest aspects of the investment thesis. The company currently pays an annualized dividend of $6.12 per share, equivalent to $1.53 per quarter. MAA declared its 130th consecutive quarterly dividend in Q2 2026.
At a share price of approximately $137.38, the forward dividend yield is: $6.12 ÷ $137.38 = approximately 4.46%
This is an attractive yield for a high-quality apartment REIT. More importantly, the dividend is supported by a relatively conservative payout ratio.
Dividend history and growth trends
MAA has paid consecutive quarterly cash dividends since 1994, giving the company a long record of returning capital to shareholders. This is an important indicator of management's long-term capital allocation discipline. The recent environment has naturally slowed dividend growth because AFFO growth has moderated. That is not necessarily negative. For a REIT facing temporary supply-related pressure, it is preferable for management to maintain a conservative payout ratio rather than aggressively increase the dividend while operating growth is weak. I therefore view MAA's dividend strategy as appropriately conservative.
AFFO payout ratio and dividend coverage
The Q2 2026 results are encouraging from a coverage perspective. MAA's Core FFO per diluted share exceeded expectations, while the annual dividend is $6.12 per share. The precise AFFO payout ratio depends on the company's definition of recurring capital expenditures and the final full-year AFFO figure, but the dividend appears to be covered by recurring cash generation with a reasonable margin.
For MAA, I would focus less on the quarterly payout ratio and more on:
- Core FFO per share;
- recurring capital expenditures;
- same-store NOI;
- development spending;
- and retained cash flow.
Because MAA owns apartment communities, recurring capital expenditures are an important distinction between FFO and true free cash flow. My assessment is that the dividend is comfortably covered under the current operating environment.
Dividend safety: Dividend safety: HIGH
I see little reason to expect a dividend cut under normal economic conditions.
The primary reasons are:
- high occupancy;
- strong resident retention;
- a diversified apartment portfolio;
- investment-grade credit ratings;
- relatively low-cost debt;
- substantial fixed-rate debt;
- and a conservative dividend policy.
The dividend risk is therefore not a near-term cut. The more realistic scenario is simply slower dividend growth until same-store NOI and AFFO growth accelerate.
Potential risks to future dividend payments
The most important risks are:
1. Prolonged Sun Belt oversupply
If rents remain stagnant for several years, AFFO growth could weaken.
2. Economic recession
A recession could increase bad debt and reduce occupancy.
3. Higher interest rates
This could raise the cost of future refinancing and development.
4. Property taxes and insurance
These costs have been increasing in many Sun Belt markets and can absorb a significant portion of rental growth.
5. Development risk
Large-scale development creates execution and lease-up risk.
6. Regulatory risk
Rent-control risk is generally lower than in some coastal markets, but state and local housing regulations remain relevant.
Overall, however, I consider the probability of a dividend cut to be low.
Valuation
Price-to-FFO and Price-to-AFFO
At approximately $137.38 per share, MAA's valuation is not obviously cheap on a headline basis, but it is becoming more attractive as the market increasingly discounts the current Sun Belt supply cycle. The key issue is that the stock's valuation depends heavily on normalized rather than current earnings growth. If the current weakness is temporary, then MAA's normalized AFFO growth potential is attractive. If the Sun Belt has structurally entered a lower-growth environment, the current valuation would be less compelling. I therefore view MAA as a normalized-earnings valuation story. That is more relevant than simply applying a multiple to a temporarily depressed growth rate.
Historical valuation range
MAA historically traded at premium valuations because investors valued:
- Sun Belt population growth;
- employment growth;
- affordability;
- and strong development opportunities.
The post-pandemic construction boom changed that equation. As apartment supply increased, the market began assigning a lower multiple because:
- rent growth slowed;
- concessions increased;
- and same-store NOI growth weakened.
The current valuation therefore represents a compromise between two views.
Bull case:
The Sun Belt remains one of the strongest long-term U.S. housing markets, supply normalizes, and MAA returns to mid-single-digit NOI and AFFO growth.
Bear case:
Permanent oversupply, insurance costs, property taxes, and weaker migration reduce the long-term growth rate.
My assessment is that the bull case is more likely over a 5–10 year horizon, but the recovery may be slower than investors expect.
NAV considerations
NAV is particularly important for MAA because apartment properties are highly liquid relative to many specialized real estate assets.
The company owns a large portfolio of multifamily communities across high-growth markets.
A NAV estimate should consider:
- stabilized NOI;
- market capitalization rates;
- current market rents;
- occupancy;
- development pipeline;
- and land value.
The challenge is that cap rates have expanded as interest rates increased. Therefore, even if property-level NOI remains stable, NAV can decline when required capitalization rates rise.
This creates a potentially attractive setup. If Treasury yields decline while apartment NOI remains stable, cap rates could compress and NAV could rise simultaneously with stronger REIT valuation multiples. That would create a favorable environment for MAA shareholders. Conversely, a prolonged high-rate environment could keep private-market valuations under pressure. I would therefore view MAA's NAV as reasonable but highly sensitive to the direction of long-term interest rates.
Balance sheet quality, leverage and debt profile
The balance sheet is one of MAA's strongest competitive advantages.
At March 31, 2026:
- Net debt was approximately $5.6 billion;
- total debt carried an average interest rate of approximately 3.9%;
- 87.1% of debt was fixed-rate;
- net debt / Adjusted EBITDAre was approximately 4.5x;
- and MAA maintained A-/A3 investment-grade credit ratings.
This is a solid financial profile. The 4.5x net debt/EBITDAre ratio is manageable for a large apartment REIT, while the high proportion of fixed-rate debt provides meaningful protection against short-term interest-rate volatility.
The balance sheet also gives MAA flexibility to:
- continue development;
- selectively acquire properties;
- repurchase shares if valuation becomes attractive;
- and fund capital expenditures.
I would classify MAA's balance sheet as: Very strong.
This is particularly important during a period of weak apartment rent growth. A highly leveraged REIT would be forced to slow investment or issue equity. MAA has considerably more flexibility.
Impact of interest rates and macroeconomic conditions
MAA is particularly sensitive to three macroeconomic factors.
Interest rates
Lower rates would be positive for:
- valuation;
- NAV;
- refinancing;
- development;
- and acquisitions.
Employment and population growth
MAA's markets benefit from long-term migration trends. However, the Sun Belt's advantage has narrowed somewhat as housing supply increased and affordability deteriorated in some major metros. The long-term demographic thesis remains intact, but the rate of growth is likely to be slower than during the peak migration period.
Apartment construction
This is currently more important than the overall economy. If new deliveries decline meaningfully, the existing apartment stock should gain pricing power.
This could result in:
- stronger new lease rates;
- higher blended lease growth;
- lower concessions;
- and improving same-store NOI.
I believe the supply cycle is the most important variable for MAA's 2027–2028 earnings trajectory.
Valuation assessment
At approximately $137 per share, I consider Mid-America Apartment Communities, Inc. fairly valued to modestly undervalued.
My approximate valuation framework would be:
- Below $125: Attractive / Strong Accumulate
- $125–135: Attractive
- $135–150: Fair value
- Above $150: Increasingly dependent on a faster Sun Belt recovery
These are valuation zones rather than precise price targets. At current prices, the market is already discounting a meaningful amount of near-term operating weakness.
However, I do not think it fully reflects the value of MAA's:
- strong balance sheet;
- development platform;
- high occupancy;
- resident retention;
- and long-term Sun Belt demographic exposure.
The stock therefore offers an interesting medium-term recovery opportunity, but I would not expect explosive near-term FFO growth.
Conclusion
Key strengths
Mid-America Apartment Communities, Inc. is a high-quality multifamily REIT with several significant competitive advantages:
- strong Sun Belt market exposure;
- high occupancy;
- excellent resident retention;
- investment-grade balance sheet;
- relatively low-cost debt;
- high fixed-rate debt exposure;
- large development pipeline;
- long dividend history;
- and conservative dividend coverage.
The most important positive factor is that MAA has the balance sheet to wait for the Sun Belt supply cycle to normalize. That is a major advantage. The company does not need to sacrifice long-term value creation simply because near-term rent growth is weak.
Key risks
The principal risks are:
- prolonged Sun Belt apartment oversupply;
- weak new-lease pricing;
- elevated insurance costs;
- property-tax inflation;
- higher interest rates;
- development lease-up risk;
- and slower population growth in some markets.
The biggest risk is not occupancy. It is rent growth. MAA can maintain 95%+ occupancy and still experience weak NOI growth if rents remain flat while expenses rise. That is exactly why I would focus on same-store NOI and blended lease growth rather than occupancy alone.
Near-term outlook
The near-term outlook is neutral to moderately positive. The Q2 2026 results demonstrate that MAA can still generate solid Core FFO despite weak rent fundamentals. The company's strong resident retention and expense management are helping to offset pressure on new lease rates. However, management's cautious outlook for same-store NOI means that I would not expect the stock to experience a major rerating until investors have greater confidence that the supply overhang is ending.
The key data points I would monitor are:
- new lease rate growth;
- renewal rate growth;
- blended effective lease growth;
- concessions;
- physical occupancy;
- same-store NOI;
- apartment deliveries in MAA's core markets;
- development yields;
- property taxes and insurance;
- and 2027 AFFO guidance.
Long-term outlook
Long-term outlook is bullish. I believe the underlying demographic case for MAA's markets remains strong.
The Southeast and Sun Belt should continue to benefit from:
- population growth;
- employment diversification;
- relatively favorable business environments;
- and lower housing costs compared with many coastal markets.
The key difference is that the short-term growth rate will probably be lower than the long-term structural growth rate. That is not necessarily a problem. MAA does not need double-digit rent growth to create attractive shareholder returns.
A more sustainable scenario of: 2–4% same-store NOI growth + 3–5% external growth + 4–5% dividend yield could still produce attractive long-term total returns, particularly if interest rates decline and the valuation multiple expands.
Investment thesis
Overall rating: BUY / ACCUMULATE ON WEAKNESS
At approximately $137 per share, I believe Mid-America Apartment Communities, Inc. offers a reasonable entry point for long-term investors.
The stock is not a deep-value opportunity, but the current valuation appears to offer a favorable balance between:
- a ~4.5% dividend yield;
- a highly sustainable dividend;
- a strong balance sheet;
- high occupancy;
- historically low resident turnover;
- and significant long-term exposure to Sun Belt housing demand.
The principal issue is timing. I would not buy MAA expecting immediate high growth. I would buy it expecting that the current apartment supply cycle will eventually normalize and that MAA's high-quality portfolio and balance sheet will allow it to emerge from that period in a stronger competitive position.
MAA is a high-quality apartment REIT temporarily operating in a difficult supply environment. The current weakness in rent growth is a genuine problem, but I believe it is cyclical rather than structural. The dividend is safe, the balance sheet is excellent, and the long-term demographic fundamentals remain favorable. At around $137, the shares appear reasonably attractive for a 5–10 year investor, while a pullback toward $125–130 would significantly improve the margin of safety.
Comments (0)
Log in to leave a comment.
No comments yet. Be the first to comment!