Price
Recent Share Price Performance
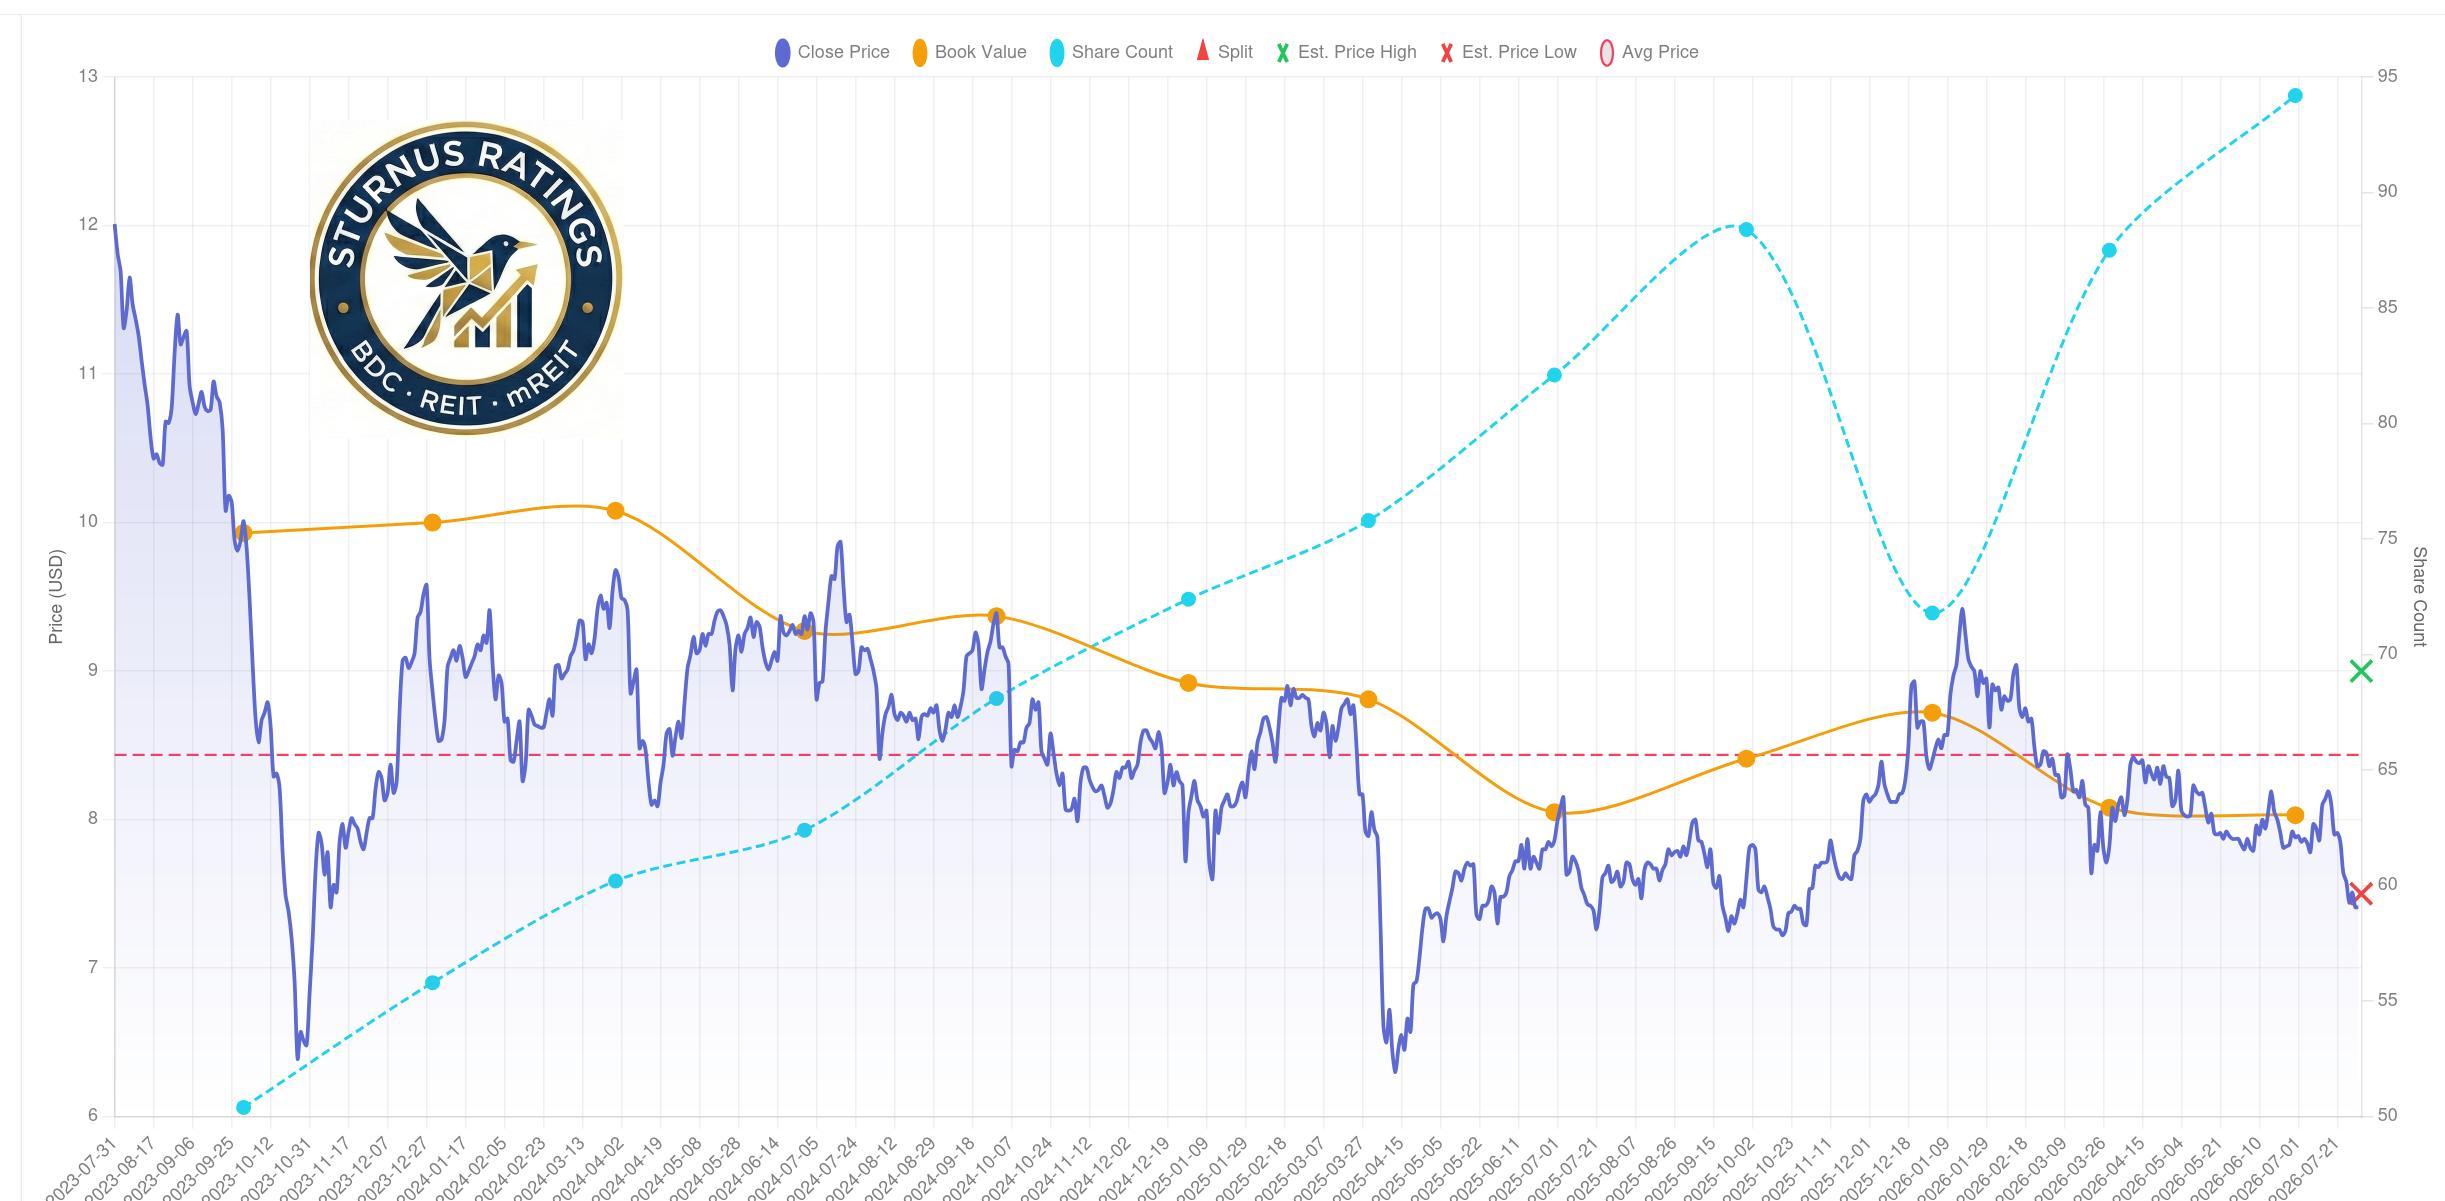
Invesco Mortgage Capital Inc. common stock trades at approximately $7.45 per share, lingering near the lower bound of its 52-week range of $7.10 to $9.50. The equity has experienced moderate downside pressure in recent months, declining approximately 5.2% over a one-month horizon and down roughly 11.4% year-to-date. Trading activity has reflected persistent headwinds across the fixed-income spectrum, primarily stemming from macroeconomic volatility, elevated long-term interest rates, and sustained yield curve inversion.
Share Price Performance Relative to Book Value Trends
Invesco Mortgage Capital Inc. reported a Book Value Per Share (BVPS) of $8.03 as of June 30, 2026 (Q2 2026), declining slightly from $8.08 at March 31, 2026 (Q1 2026) and down from $8.72 at year-end 2025. The stock price has historically traded at a persistent discount to its reported BVPS, trailing the gradual contraction in equity value over the past four quarters. While BVPS stabilized during Q2 2026 (contracting by just $0.05 per share), equity markets have continued to price the stock at a wider discount, signaling skepticism regarding long-term book value preservation under an elevated risk-free rate structure.
Price-to-Book (P/B) Ratio Analysis. Based on a share price of $7.45 and Q2 2026 reported BVPS of $8.03, Invesco Mortgage Capital Inc. trades at a Price-to-Book ratio of 0.93x (a ~7% discount to reported net asset value).
Comparison with Historical Valuation Ranges
Historically, pure-play Agency mREITs trade between 0.85x and 1.05x P/B depending on interest rate volatility and Federal Reserve monetary cycles. Invesco Mortgage Capital Inc.'s historical average valuation has fluctuated near 0.90x–0.95x P/B in periods of rate stability, but drops below 0.80x during acute mortgage spread widening. The current 0.93x multiple represents a mid-range historical valuation, indicating that market participants are neither pricing in extreme distress nor rewarding the entity with a premium.
Comparison with Relevant mREIT Peers
- AGNC Investment Corp. (AGNC): ~0.98x–1.02x P/B
- Annaly Capital Management, Inc. (NLY): ~0.95x–1.00x P/B
- Dynex Capital, Inc. (DX): ~0.92x–0.96x P/B
- Invesco Mortgage Capital Inc. (IVR): ~0.93x P/B
Invesco Mortgage Capital Inc. trades at a modest discount relative to tier-one pure Agency peers like AGNC and Annaly. This discount reflects the company's smaller equity base, higher leverage profile, and history of aggressive diluted share issuances under At-The-Market (ATM) equity offerings.
Key Factors Influencing Investor Sentiment
- Interest Rate Volatility: Fluctuations in 10-year U.S. Treasury yields and interest rate swap spreads directly alter portfolio valuations and hedging efficiency.
- Dilutive ATM Issuance: Continued issuance of common shares via ATM programs during periods where the stock traded near or below BVPS creates dilution concerns among institutional holders.
- MBS Spread Volatility: The widening or tightening of Agency RMBS spreads relative to benchmark Treasuries directly impacts tangible net asset value.
Market Expectations Reflected in Current Share Price
At 0.93x P/B, the market is pricing in modest further book value erosion alongside expectations of potential dividend rightsizing over a 12-to-18-month horizon if interest rate swap costs remain elevated.
Dividend
Current Dividend Yield
Invesco Mortgage Capital Inc. currently pays a monthly dividend of $0.12 per share, equivalent to a quarterly payout of $0.36 per share ($1.44 annualized). Based on a stock price of $7.45, the forward dividend yield stands at 19.33%.
Dividend History and Trend Analysis
The company modified its dividend payment structure from quarterly distributions to monthly distributions ($0.12/month). Over a multi-year horizon, Invesco Mortgage Capital Inc. has undergone several reverse stock splits and dividend adjustments following systemic shocks (most notably during the 2020 liquidity crunch and the Fed's 2022–2023 rate hike cycle). The distribution trend has stabilized over recent quarters at $0.36 per quarter ($0.12 per month), but coverage metrics have tightened significantly.
Distribution Earnings, EAD, or Distributable Earnings Coverage
For Q2 2026, Invesco Mortgage Capital Inc. reported Earnings Available for Distribution (EAD) of $47.1 million, or $0.50 per common share, compared to $0.55 per common share in Q1 2026.
- Q2 2026 Common Dividend Declared: $0.36 per share
- Q2 2026 EAD Per Share: $0.50 per share
EAD Dividend Coverage Ratio: 138.9% (EAD / Dividend = $0.50 / $0.36) Dividend Payout Ratio
On an EAD basis, the payout ratio stands at 72.0% ($0.36 / $0.50). However, when evaluating GAAP Net Income, results remain volatile due to mark-to-market adjustments on securities and derivatives. In Q2 2026, GAAP net income per share was $0.34, yielding a GAAP payout ratio of 105.9%.
Assessment of Dividend Safety and Sustainability
While headline EAD coverage appears robust at 138.9% ($0.50 EAD vs. $0.36 dividend), dividend safety is moderate to fragile due to the following underlying operational conditions:
- EAD Erosion: EAD per share declined 9.1% quarter-over-quarter from $0.55 in Q1 2026 to $0.50 in Q2 2026.
- Dilution from Equity Capital Raises: ATM share issuances enlarge the total common share count (14.8 million common shares issued in Q2 2026 alone), raising the aggregate dollar outlay needed to maintain the dividend.
- Rollover Risk on Swaps: As legacy higher-yielding interest rate hedges mature, replacement hedges at higher market rates will narrow net interest spread, compressing future EAD.
Potential Catalysts for Dividend Increases or Reductions
- Catalysts for Reduction: A continued compression of net interest margin, further stock dilution via below-NAV equity sales, or widening mortgage spreads that force portfolio deleveraging.
- Catalysts for Increase: A sustained drop in short-term repurchase agreement funding costs triggered by aggressive Federal Reserve rate cuts, alongside lower yield volatility.
Management's Dividend Outlook
Management continues to align distribution targets with long-term net portfolio yields rather than short-term spikes in interest rate swap gains. The current monthly distribution structure ($0.12/month) offers operational flexibility, though management retains the mandate to adjust distributions should asset yields compress below funding costs.
Valuation
Current Price-to-Book Valuation
Invesco Mortgage Capital Inc. is valued at 0.93x P/B based on a $7.45 market price and $8.03 Q2 2026 reported BVPS.
Historical Price-to-Book Comparison
Compared to its 5-year post-restructuring historical average P/B range of 0.88x–0.96x, the current valuation reflects standard market pricing for an Agency-focused mREIT operating in an elevated interest rate environment.
Book Value Per Share Trend Analysis
- Q4 2025 BVPS: $8.72
- Q1 2026 BVPS: $8.08 (-7.3% sequential change)
- Q2 2026 BVPS: $8.03 (-0.6% sequential change)
The sharp drop in Q1 2026 was caused by mortgage spread widening and rate volatility, while Q2 2026 showed relative stabilization due to positive returns in Agency RMBS excess carry and tighter risk premiums.
Economic Return Analysis
- Q1 2026 Economic Return: -3.2% (BV contraction of $0.64 plus $0.36 dividend)
- Q2 2026 Economic Return: +3.8% (BV contraction of $0.05 plus $0.36 dividend)
- YTD 2026 Economic Return: +0.6%
The return trajectory highlights that while monthly dividend payouts generate income, capital preservation remains challenged by underlying portfolio mark-to-market movements.
Portfolio Composition and Risk Profile
As of June 30, 2026, Invesco Mortgage Capital Inc.'s total investment portfolio stood at $8.15 billion (including TBAs at implied market value):
- Agency RMBS: $6.0 billion (~73.6%)
- Agency TBA (To-Be-Announced) Positions: $1.2 billion (~14.7%)
- Agency CMBS: $0.9 billion (~11.1%)
The portfolio is concentrated almost entirely in government-guaranteed Agency securities, eliminating credit risk while exposing the firm to interest rate risk, extension risk, and prepayment risk. Agency CMBS provides prepayment protection and stable cash flows.
Leverage Analysis
- GAAP Debt-to-Equity Ratio: 6.3x (vs. 6.1x in Q1 2026)
- Economic Debt-to-Equity Ratio (including TBAs): 7.5x (unchanged from Q1 2026)
An economic leverage ratio of 7.5x is in line with Agency mREIT industry standards (typically 7.0x–8.5x). However, it leaves limited balance sheet buffer if Agency spreads widen abruptly.
Funding Costs and Interest Rate Sensitivity
The company relies heavily on short-term Repurchase Agreements (Repo) secured by Agency MBS. Total interest expense for Q2 2026 was $55.3 million against total interest income of $85.4 million, yielding Net Interest Income of $30.1 million. High short-term repo rates continue to pressure the unhedged cost of funds, making receiver swap performance critical to maintaining positive net interest spread.
Hedging Strategy Effectiveness
Invesco Mortgage Capital Inc. uses interest rate swaps, SOFR futures, and Treasury futures to hedge against rising interest rates and yield curve shifts. Hedging performance in Q2 2026 successfully offset benchmark rate increases, but hedges do not protect against mortgage basis risk (the spread between Agency MBS yields and benchmark Treasury/swap yields).
Impact of Federal Reserve Policy and Macroeconomic Conditions
- Quantitative Tightening (QT) & Supply: The Federal Reserve's balance sheet runoff leaves private investors to absorb Agency MBS supply, keeping mortgage spreads wider than historical averages.
- Federal Funds Target Rate: A prolonged "higher-for-longer" Fed policy keeps short-term repo borrowing costs elevated, compressing net interest margin.
- Interest Rate Volatility: High yield volatility increases the cost of dynamic hedging and penalizes Agency MBS valuations.
Relative Valuation Versus Peer mREITs
Invesco Mortgage Capital Inc. trades at a slight discount to peer averages, appropriate given its smaller market capitalization ($758.8M), higher economic leverage, and recent capital dilution via ATM stock sales.
Valuation Summary
Shares appear fairly valued at 0.93x P/B. The stock offers high current yield, but lacks a compelling structural catalyst for significant P/B multiple expansion in the absence of Fed rate cuts or spread tightening.
Conclusion
Summary of Key Strengths
- High Liquidity Reserve: Maintained $548.3 million in unrestricted cash and unencumbered investments as of Q2 2026, providing operational flexibility.
- Pure-Play Agency Portfolio: Virtually zero credit risk due to explicit/implicit government guarantees on underlying RMBS, CMBS, and TBA holdings.
- Adequate Near-Term Dividend Coverage: Q2 2026 EAD of $0.50 per share provides 138.9% coverage over the $0.36 quarterly ($0.12 monthly) dividend payout.
Summary of Key Risks
- EAD Erosion: Earnings Available for Distribution per share declined from $0.55 in Q1 2026 to $0.50 in Q2 2026.
- Dilutive Capital Raises: Frequent use of the ATM program (issuing 14.8M shares in Q2 2026 alone) increases the share count and risks diluting per-share equity value if executed below NAV.
- Interest Rate Volatility & Leverage: An 7.5x economic leverage ratio heightens sensitivity to mortgage spread widening.
Outlook for Book Value and Earnings
Book value is expected to remain range-bound ($7.80–$8.30) in the near term. Net interest margin will remain under pressure until short-term repo rates decline.
Outlook for Dividend Sustainability
The current $0.12 monthly distribution ($0.36/quarter) is sustainable in the short term based on current EAD ($0.50). However, if EAD continues its downward trend toward $0.40 due to higher funding costs or dilution, the margin of safety will narrow.
Expected Impact of Management Guidance and Federal Reserve Policy
Lower interest rate volatility and potential Fed easing represent primary positive catalysts. Conversely, delayed monetary easing will maintain high repo borrowing costs, capping EAD upside.
Near-Term and Long-Term Outlook
- Near-Term (0–6 Months): Neutral. High yield (19.3%) provides income, but share price upside is constrained by yield curve conditions.
- Long-Term (12+ Months): Moderately positive if central bank easing cycles normalize the yield curve and reduce repo funding costs.
Investment Thesis
Invesco Mortgage Capital Inc. presents a Hold / Neutral profile. The stock serves as a high-yield income vehicle for investors seeking exposure to Agency mortgage spreads. However, due to ongoing share dilution risks from ATM issuances and macroeconomic interest rate headwinds, capital appreciation potential remains limited until monetary policy shifts toward a lower short-term rate regime.
Comments (0)
Log in to leave a comment.
No comments yet. Be the first to comment!