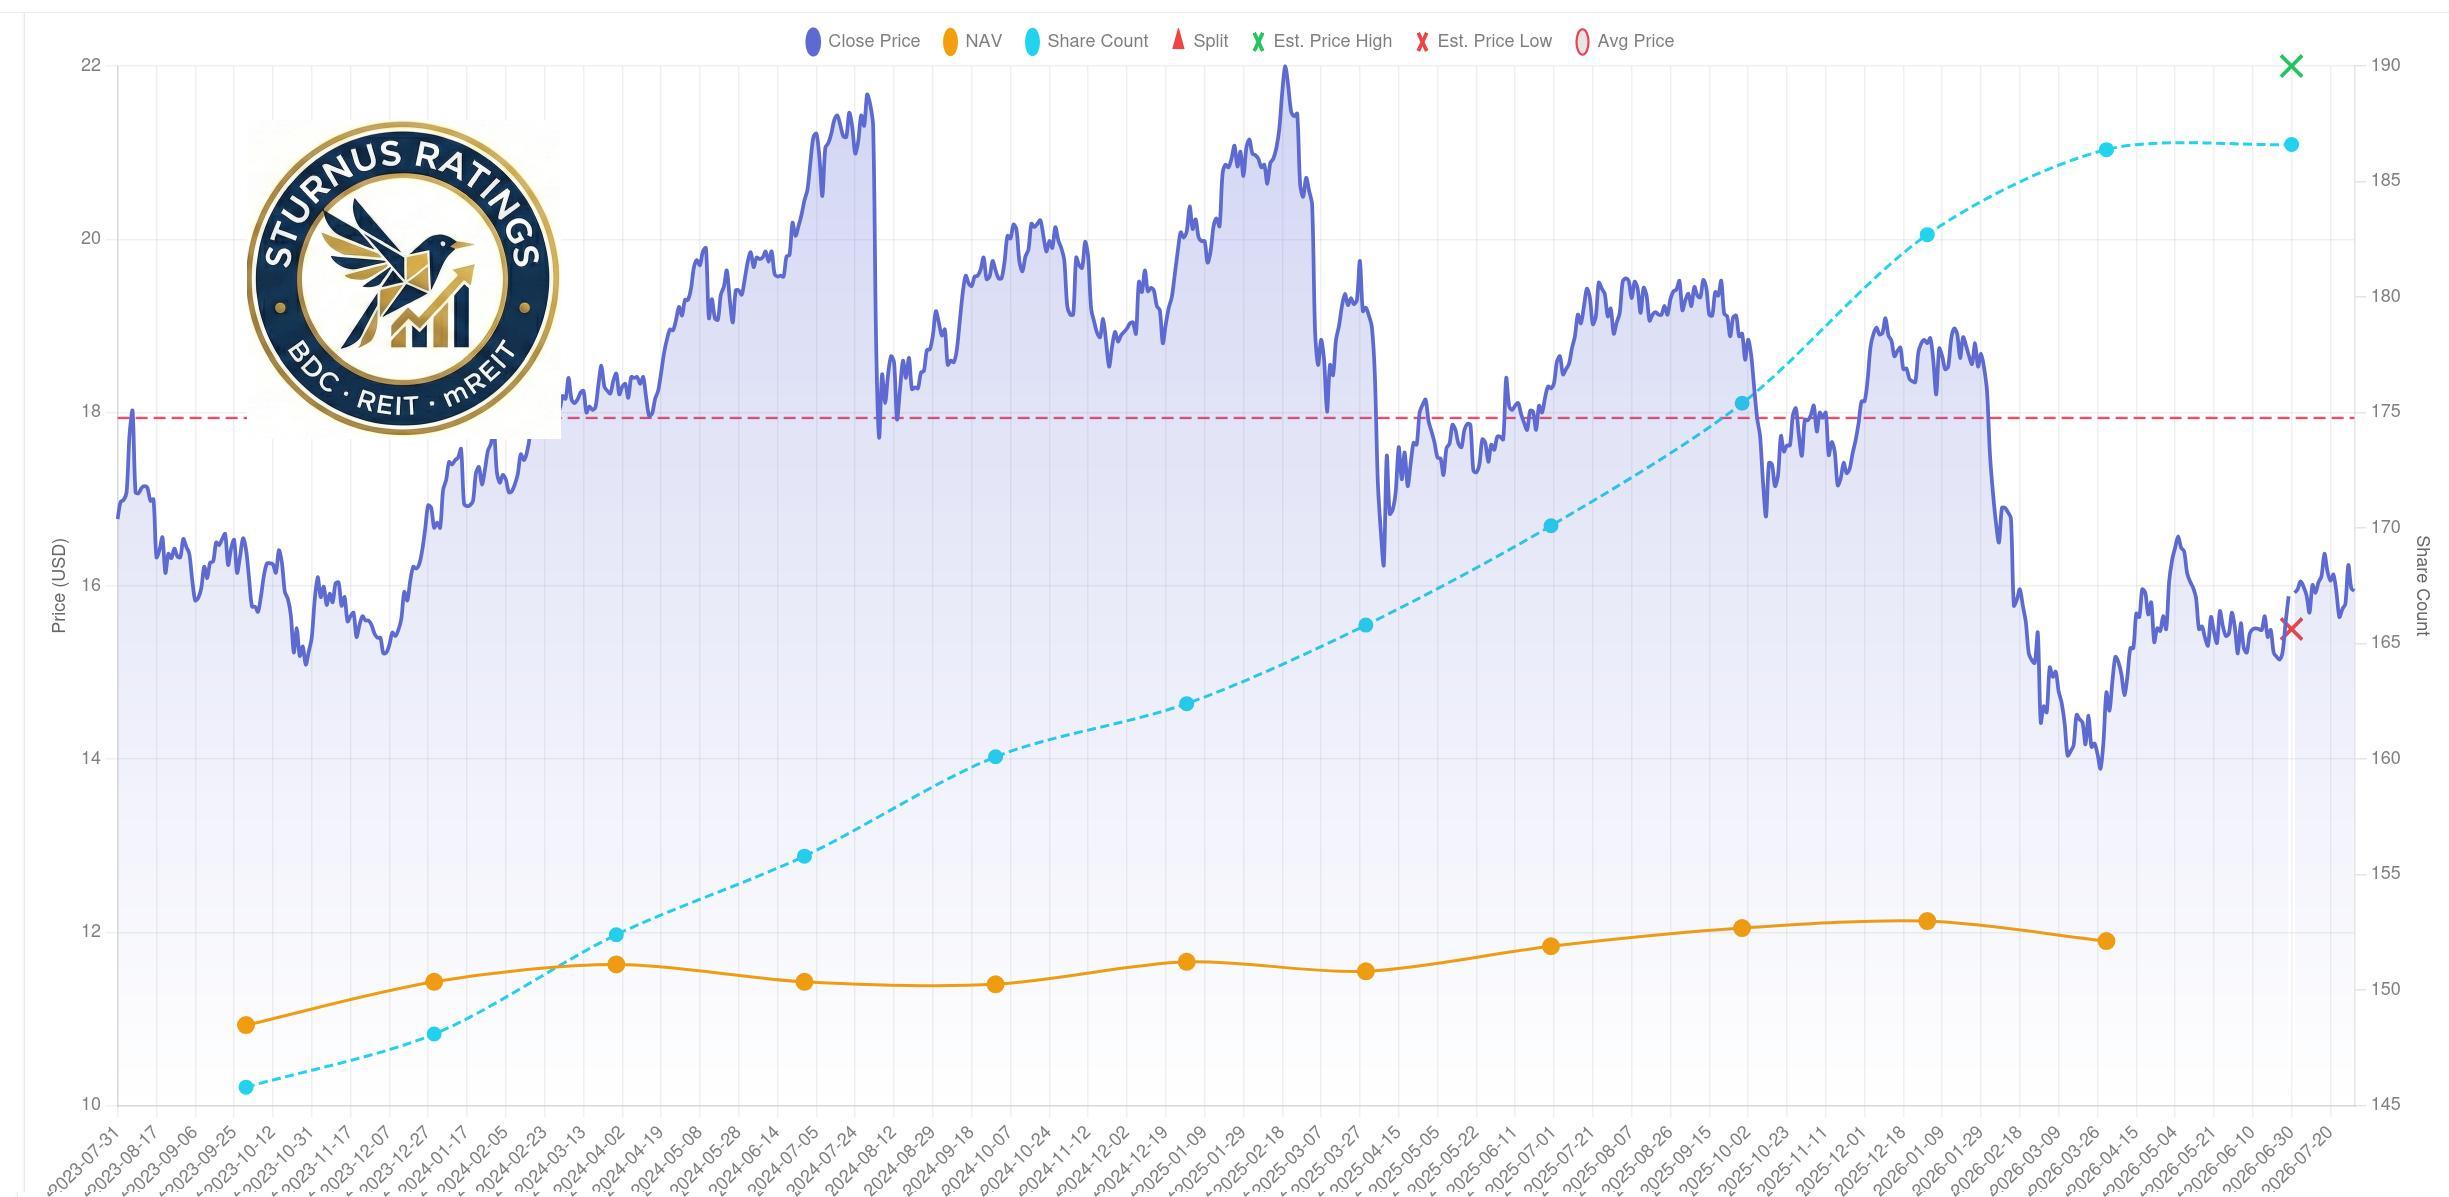
Price
Hercules Capital, Inc. is fundamentally different from most large BDCs. Its core business is not conventional middle-market direct lending. Instead, the company specializes in senior secured venture-growth loans to innovative companies backed by venture capital and private equity investors, particularly in technology and life sciences. This gives Hercules a differentiated competitive position but also creates a different risk profile.
The company is exposed to:
- venture capital funding conditions;
- technology-sector valuations;
- private-company liquidity;
- IPO and M&A markets;
- cash-burn rates;
- and the availability of follow-on equity financing.
The share price has therefore historically traded with greater sensitivity to sentiment toward venture capital, technology and private credit than many traditional BDCs. As of the latest available market data, Hercules Capital, Inc. closed at approximately $15.94 per share on July 31, 2026. This compares with preliminary Q2 NAV per share of $12.10–$12.20. That implies an estimated P/NAV range of approximately: 1.31×–1.32× NAV or a premium of approximately 31%–32% to NAV. This is not a low valuation in absolute terms.
However, it is important to understand that HTGC has historically commanded a premium valuation because of:
- its specialized origination platform;
- long-term NAV performance;
- strong NII generation;
- equity and warrant upside;
- and relatively low historical credit losses.
The question is therefore not whether HTGC trades above NAV—it clearly does—but whether the ~31% premium is justified by future NAV growth and earnings power.
Share price performance relative to NAV
Q2 2026 was significantly better from a NAV perspective than Q1. Hercules Capital, Inc. reported Q1 NAV per share of $11.90. The preliminary Q2 estimate was $12.10–$12.20, representing an increase of:
- $0.20–$0.30 per share
- approximately 1.7%–2.5% sequential NAV growth
This is an important positive development. The combination of: NII ≈ $0.50/share + NAV growth + net realized gains is significantly more attractive than simply producing high cash income while allowing NAV to decline.
For long-term BDC investors, this is one of the most important characteristics of a high-quality BDC: The company should generate income without sacrificing NAV. Q2 appears to have delivered both.
Price-to-NAV analysis
Using:
- Share price: approximately $15.94
- NAV range: $12.10–$12.20
We obtain: P/NAV ≈ 1.31×–1.32× This means investors are paying approximately $1.31–$1.32 for every $1.00 of reported NAV. That is a substantial premium. However, HTGC's premium valuation has a fundamental rationale.
The market is effectively paying for:
- superior historical credit performance;
- specialized venture-debt expertise;
- strong origination capabilities;
- attractive risk-adjusted portfolio yields;
- potential warrant/equity gains;
- strong dividend coverage;
- and long-term NAV growth.
The problem is that the higher the premium becomes, the more important NAV growth is. If HTGC trades at 1.3× NAV but NAV grows 5%–7% annually, the premium may be justified. If NAV stagnates or declines, a 1.3× valuation becomes much more vulnerable.
Historical valuation range
HTGC's valuation has historically fluctuated substantially depending on investor perception of:
- venture lending risk;
- technology valuations;
- credit losses;
- interest rates;
- and the sustainability of its dividend.
The company's share price experienced significant pressure during the broader concerns surrounding venture debt and technology exposure, but the subsequent recovery in operating performance has improved the fundamental picture. The current estimated 1.31×–1.32× P/NAV is therefore not a distressed valuation. I would characterize it as: A premium valuation that requires continued execution.
The market is not pricing HTGC as an average BDC. It is pricing the company as a high-quality specialty BDC with above-average earnings and NAV-generation potential.
Comparison with relevant BDC peers
The most relevant peers include:
- Ares Capital Corporation
- Main Street Capital Corporation
- TriplePoint Venture Growth BDC Corp.
- Trinity Capital Inc.
The comparison is complicated because the business models differ.
Ares Capital Corporation offers significantly broader middle-market diversification.
Main Street Capital Corporation benefits from an internally managed structure and a lower-middle-market strategy.
Trinity Capital Inc. is more comparable in terms of venture debt but has a smaller platform.
TriplePoint Venture Growth BDC Corp. is also focused on venture-growth lending but has historically carried greater credit and balance-sheet concerns.
Hercules therefore occupies a relatively strong position within the specialty venture-debt BDC segment.
Market sentiment and investor expectations
The Q2 results were fundamentally encouraging.
The key positive factors were:
- NII around $0.50/share;
- NAV growth of approximately 2%;
- $7.7 million of estimated net realized gains;
- approximately $900 million of new investment commitments;
- approximately $600 million of new fundings;
- and non-accruals remaining below 0.5% at cost.
The principal negative factor was the increase in non-accrual investments from 0.2% to less than 0.5% at cost. While this remains very low for a BDC, the direction deserves monitoring. (PublicNow)
Overall, Q2 should be viewed as a strong operating quarter with a small but notable deterioration in credit metrics.
Dividend
Current dividend yield
Hercules Capital, Inc. declared a $0.47 total cash distribution per share for Q2 2026.
The distribution consists of:
- $0.40 base distribution
- $0.07 supplemental distribution
The annualized base dividend is: $1.60 per share. The current total distribution, if repeated quarterly, would equal: $1.88 per share.
At a $15.94 share price, this represents:
Base dividend yield
$1.60 ÷ $15.94 = approximately 10.0%
Total distribution yield
$1.88 ÷ $15.94 = approximately 11.8%
The 11.8% figure should not be interpreted as a guaranteed forward yield because the supplemental distribution can vary. For valuation purposes, I prefer to use the ~10.0% base yield and treat the supplemental distribution as additional upside.
NII and dividend coverage
This is where the Q2 results materially improve the investment thesis.
Q2 2026 NII was approximately: $0.50 per share
The distribution was: $0.47 per share
Therefore: Total distribution coverage = $0.50 ÷ $0.47 = 1.064× or approximately: 106% coverage.
The base dividend coverage was: $0.50 ÷ $0.40 = 1.25× or: 125% coverage. This gives us two very different conclusions.
Base dividend: 125% NII coverage. This is very strong.
Total distribution: 106% NII coverage. This is still positive, but the margin of safety is considerably smaller. This is exactly how I would evaluate the dividend: The $0.40 base distribution is comfortably covered by recurring NII, while the $0.07 supplemental distribution was also covered by Q2 NII, but with only a modest 6% cushion. This is an excellent result for Q2, but I would not assume that the $0.47 total distribution is permanently guaranteed every quarter.
Dividend payout ratio
The payout ratio is therefore healthy for the base dividend. The total payout ratio of approximately 94% leaves a limited but positive current-quarter cushion.
Spillover income
The latest fully reported Q1 figure showed $149.1 million of undistributed earnings spillover, or approximately $0.80 per ending share.
This is a significant reserve.
The spillover provides protection if:
- NII temporarily declines;
- repayments reduce income;
- interest rates fall;
- investment activity slows;
- or taxable income fluctuates.
However, I would not use spillover as a substitute for recurring NII. The most important development in Q2 is that current NII itself covered the entire $0.47 distribution. That makes the dividend situation materially healthier than if the supplemental payment were being funded primarily from accumulated spillover.
Dividend safety
My assessment is: $0.40 base distribution: Very safe. The 1.25× NII coverage provides a meaningful cushion. $0.47 total distribution: Safe at present, but more variable. The 1.06× coverage is positive but leaves limited room for an earnings decline. The substantial spillover balance provides an additional buffer. Therefore: I see a very low risk of a cut to the $0.40 base distribution in the near term. The greater uncertainty is whether the company can continue paying the full $0.07 supplemental distribution every quarter.
Potential catalysts for dividend changes
Potential positive catalysts
- Higher portfolio yields;
- strong new investment activity;
- continued low non-accruals;
- higher prepayment income;
- warrant monetizations;
- strong venture financing markets;
- continued NAV growth.
Potential negative catalysts
- Federal Reserve rate cuts;
- lower floating-rate income;
- higher funding costs;
- rising non-accruals;
- weaker venture capital markets;
- lower prepayment activity;
- higher realized credit losses.
At present, I expect the base dividend to remain stable, while supplemental distributions may fluctuate.
Valuation
Current P/NAV valuation
At approximately $15.94 per share and estimated Q2 NAV of $12.10–$12.20: P/NAV = approximately 1.31×–1.32×. This is a premium valuation. The premium is justified only if Hercules can continue generating:
- high NII;
- strong dividend coverage;
- NAV growth;
- low credit losses.
Q2 2026 provided evidence supporting all four, although the increase in non-accruals deserves monitoring.
NAV per share trend
Q1 NAV: $11.90
Q2 preliminary NAV: $12.10–$12.20
Sequential increase: +1.7% to +2.5%
This is an excellent quarterly NAV result. It suggests that the company is not merely distributing income—it is also preserving and growing shareholder capital. The approximately $7.7 million of net realized gains contributed positively to the quarter, although the complete NAV bridge will be needed to determine precisely how much of the NAV increase came from:
- realized gains;
- unrealized appreciation;
- retained earnings;
- share issuance;
- and other capital movements.
The direction, however, is clearly positive.
Net Investment Income trend
Q1 2026: $0.48 NII/share
Q2 2026: approximately $0.50 NII/share
Sequential improvement: approximately 4.2%
This is a positive trend. More importantly, Q2 NII remained above both:
- the $0.40 base distribution;
- and the $0.47 total distribution.
The earnings profile is therefore currently strong enough to support the dividend without relying heavily on realized gains.
Portfolio yield and earnings quality
Hercules' earnings are generated from a combination of:
- floating-rate venture loans;
- upfront fees;
- prepayment fees;
- PIK income;
- and equity/warrant investments.
The highest-quality earnings are recurring cash interest.
The less predictable components are:
- prepayment fees;
- PIK income;
- and equity-related gains.
For this reason, the Q2 NII result should be analyzed alongside the portfolio's cash interest collection. If NII growth is driven primarily by recurring cash interest, that is highly positive. If it is increasingly driven by PIK or one-off fees, the quality of earnings is lower. This will be an important consideration in the final Q2 10-Q.
Non-accrual analysis and credit quality
The Q2 non-accrual data are mixed but remain fundamentally strong.
Non-accrual investments:
- Q1: 0.2% of portfolio at cost
- Q2: <0.5% at cost
The increase is therefore approximately 20–30 basis points, depending on the final Q2 figure. This is a negative trend. However, the absolute level remains extremely low. I therefore do not view the Q2 increase as evidence of broad portfolio deterioration. The more important question is whether the increase represents:
- one isolated borrower;
- several small credits;
- or a broader increase across technology and life-science portfolios.
The answer will determine whether this is merely noise or the beginning of a credit trend. At this stage: Credit quality remains strong, but the Q2 non-accrual increase should be monitored.
Portfolio composition and diversification
Hercules is highly diversified by individual portfolio company but concentrated by investment theme. The company has committed more than $27 billion to over 700 companies since inception and manages approximately $6.1 billion of assets.
The advantages are:
- deep sector expertise;
- strong venture-capital relationships;
- extensive deal sourcing;
- and significant experience underwriting venture debt.
The primary risk is: correlation among portfolio companies during periods of weak venture funding. A recession in traditional middle-market lending is not the only risk.
HTGC could experience problems if:
- venture capital fundraising slows;
- IPO markets close;
- technology valuations fall;
- or portfolio companies cannot raise additional equity.
The company is therefore diversified by borrower but less diversified by economic ecosystem.
Leverage and balance sheet
Q1 2026 leverage was:
- Net GAAP leverage: 113.5%
- Net regulatory leverage: 97.8%
This represented conservative balance-sheet management and left room for additional growth. The Q2 investment activity—approximately $900 million of new commitments and $600 million of fundings—shows that the company continues to deploy capital actively.
The company also priced a new: $325 million of 6.30% unsecured notes due 2031
in July 2026 and subsequently closed the offering. The transaction improves funding duration and liquidity but carries a relatively high fixed coupon. The key question is whether HTGC can deploy this capital at sufficiently attractive yields. Given the company's current earnings performance, I view the funding transaction as manageable and strategically positive, although not cheap.
Liquidity and debt maturity profile
Liquidity remains one of Hercules' strengths. At the end of Q1, the company had more than $1 billion of available liquidity, including liquidity associated with adviser funds. The new 2031 notes further extend the maturity profile. This reduces refinancing risk. The main concern is therefore not liquidity itself but: the cost of future funding relative to portfolio yields. If funding costs remain elevated while asset yields decline, NII margins could compress.
Federal Reserve policy and macroeconomic conditions
The Federal Reserve's policy is a mixed factor for Hercules.
Higher rates
Positive:
- higher income from floating-rate loans.
Negative:
- greater debt-service pressure on venture-backed borrowers;
- higher refinancing risk;
- potentially higher non-accruals.
Lower rates
Negative:
- lower floating-rate portfolio income.
Positive:
- lower borrowing costs for portfolio companies;
- improved liquidity;
- potentially better venture financing conditions;
- lower credit risk.
For Hercules, the ideal environment is likely: moderately declining interest rates + healthy economic growth + active venture capital markets. That combination would reduce borrower stress without creating an abrupt collapse in portfolio yields.
Relative valuation
At approximately 1.31×–1.32× NAV, HTGC is clearly not a cheap BDC on an asset-value basis.
However, I believe the premium is supported by:
- superior historical credit performance;
- specialized underwriting expertise;
- strong origination;
- low non-accruals;
- strong NII;
- NAV growth;
- and potential equity/warrant upside.
The valuation becomes difficult to justify if:
- NAV growth stops;
- NII declines below the dividend;
- non-accruals rise materially;
- or supplemental distributions disappear.
At the current operating level, however, I believe HTGC deserves to trade above NAV. The question is whether 1.3× NAV is too high. It is not obviously excessive, but it leaves less margin of safety than buying HTGC around NAV or at a modest premium.
Conclusion
The Q2 2026 results strengthen the Hercules Capital, Inc. investment thesis.
The company's main strengths are:
- Q2 NII of approximately $0.50/share;
- 125% coverage of the $0.40 base distribution;
- approximately 106% coverage of the $0.47 total distribution;
- NAV growth of approximately 1.7%–2.5%;
- approximately $7.7 million of net realized gains;
- approximately $900 million of new investment commitments;
- approximately $600 million of new fundings;
- non-accruals still below 0.5% at cost;
- substantial spillover income;
- strong liquidity;
- and access to long-term unsecured funding.
This is an impressive combination.
Key risks
The most important risks remain:
Venture-credit concentration
HTGC is exposed to the health of the venture capital ecosystem.
Technology exposure
Technology and life sciences can experience significant valuation and financing cycles.
NAV premium
At approximately 1.31×–1.32× NAV, investors have limited valuation margin of safety.
Interest rates
Lower rates could reduce portfolio yields.
Funding costs
The new 6.30% unsecured notes demonstrate that incremental financing is relatively expensive.
Non-accrual trend
The increase from 0.2% to below 0.5% at cost is small but should be monitored.
Supplemental dividend
The $0.07 supplemental distribution is less predictable than the $0.40 base dividend.
Outlook for NAV
The Q2 NAV trajectory is encouraging. An increase from $11.90 to $12.10–$12.20 represents a meaningful improvement. If Hercules can continue generating: NII + realized gains + low credit losses
then NAV should remain stable to positive over the medium term. The key risk would be a deterioration in venture-credit conditions that produces realized losses and NAV markdowns. For now, the NAV outlook is: Positive.
Outlook for NII
Q2 NII of approximately $0.50/share represents a healthy earnings level. The most important issue going forward is the Federal Reserve rate cycle. If short-term rates decline, HTGC will eventually face pressure on floating-rate investment income.
However, this could be partially offset by:
- lower borrower stress;
- higher investment activity;
- lower credit losses;
- and potentially stronger venture financing conditions.
My base case is: NII remains sufficient to cover the $0.40 base dividend, but the $0.07 supplemental distribution should be viewed as variable.
Outlook for dividend sustainability
My dividend assessment is: Base dividend: Very safe, $0.40 versus $0.50 NII/share gives 125% coverage.
Total $0.47 distribution: Currently sustainable, $0.47 versus $0.50 NII/share gives approximately 106% coverage.
Supplemental distribution: Not guaranteed
It is supported by current NII and spillover income but remains more vulnerable to earnings volatility. The dividend therefore appears materially safer than the market price alone might suggest.
Assessment of portfolio credit quality
My current assessment is: Strong, with a minor negative trend that requires monitoring.
The increase in non-accruals is not yet concerning in absolute terms. A non-accrual level below 0.5% at cost remains very low. However, the direction from 0.2% to <0.5% is worth watching.
If Q3 shows non-accruals stabilizing or declining, I would consider the Q2 increase largely immaterial. If non-accruals rise above 1% and continue trending upward, I would become substantially more cautious.
Expected impact of Federal Reserve policy
The Fed's policy will probably become increasingly important for HTGC. The most favorable scenario is: gradual rate cuts + stable economic growth + healthy venture financing. The least favorable scenario is: high rates + weak venture funding + rising borrower defaults. The current environment remains closer to the first scenario than the second, although inflation remains a risk to the pace of monetary easing.
Final Investment Thesis
Hercules Capital, Inc. delivered a strong Q2 2026 from the perspective of long-term shareholders.
The key numbers tell the story:
$0.50 NII/share
$0.47 total distribution
1.06× total dividend coverage
1.25× base dividend coverage
$12.10–$12.20 estimated NAV
+1.7% to +2.5% sequential NAV growth
<0.5% non-accruals at cost
~$900 million new commitments
~$600 million fundings
These are strong results for a specialty BDC. The biggest positive is that Hercules generated both strong NII and NAV growth. This is exactly the combination long-term BDC investors should seek. The biggest concern is valuation. At approximately $15.94 per share, HTGC trades at roughly 1.31×–1.32× estimated Q2 NAV. That is a substantial premium, and therefore the company must continue to demonstrate superior credit performance and NAV growth to justify it.
My conclusion is therefore: Hercules Capital, Inc. is fundamentally attractive, but valuation-sensitive.
I would classify the shares as:
BUY / ACCUMULATE for long-term investors at an acceptable premium to NAV.
HOLD if the premium expands materially without corresponding NAV and NII growth.
I would not recommend selling simply because HTGC trades above NAV. The Q2 results demonstrate why the market awards Hercules a premium: the company is currently generating strong recurring income, covering its dividend, growing NAV and maintaining exceptionally low non-accrual levels.
The $0.40 base dividend appears highly secure, while the $0.07 supplemental dividend is currently covered but should remain variable in an investor's valuation model.
The central investment thesis is therefore: HTGC offers one of the more attractive combinations of high current income, NAV growth potential and specialized lending expertise in the BDC universe. However, the ~31% premium to NAV means investors are paying for that quality upfront. The shares are attractive for investors who believe Hercules can continue compounding NAV and NII, but the margin of safety is considerably smaller than it would be at a price closer to NAV.
Comments (0)
Log in to leave a comment.
No comments yet. Be the first to comment!