Price
Recent Share Price Performance
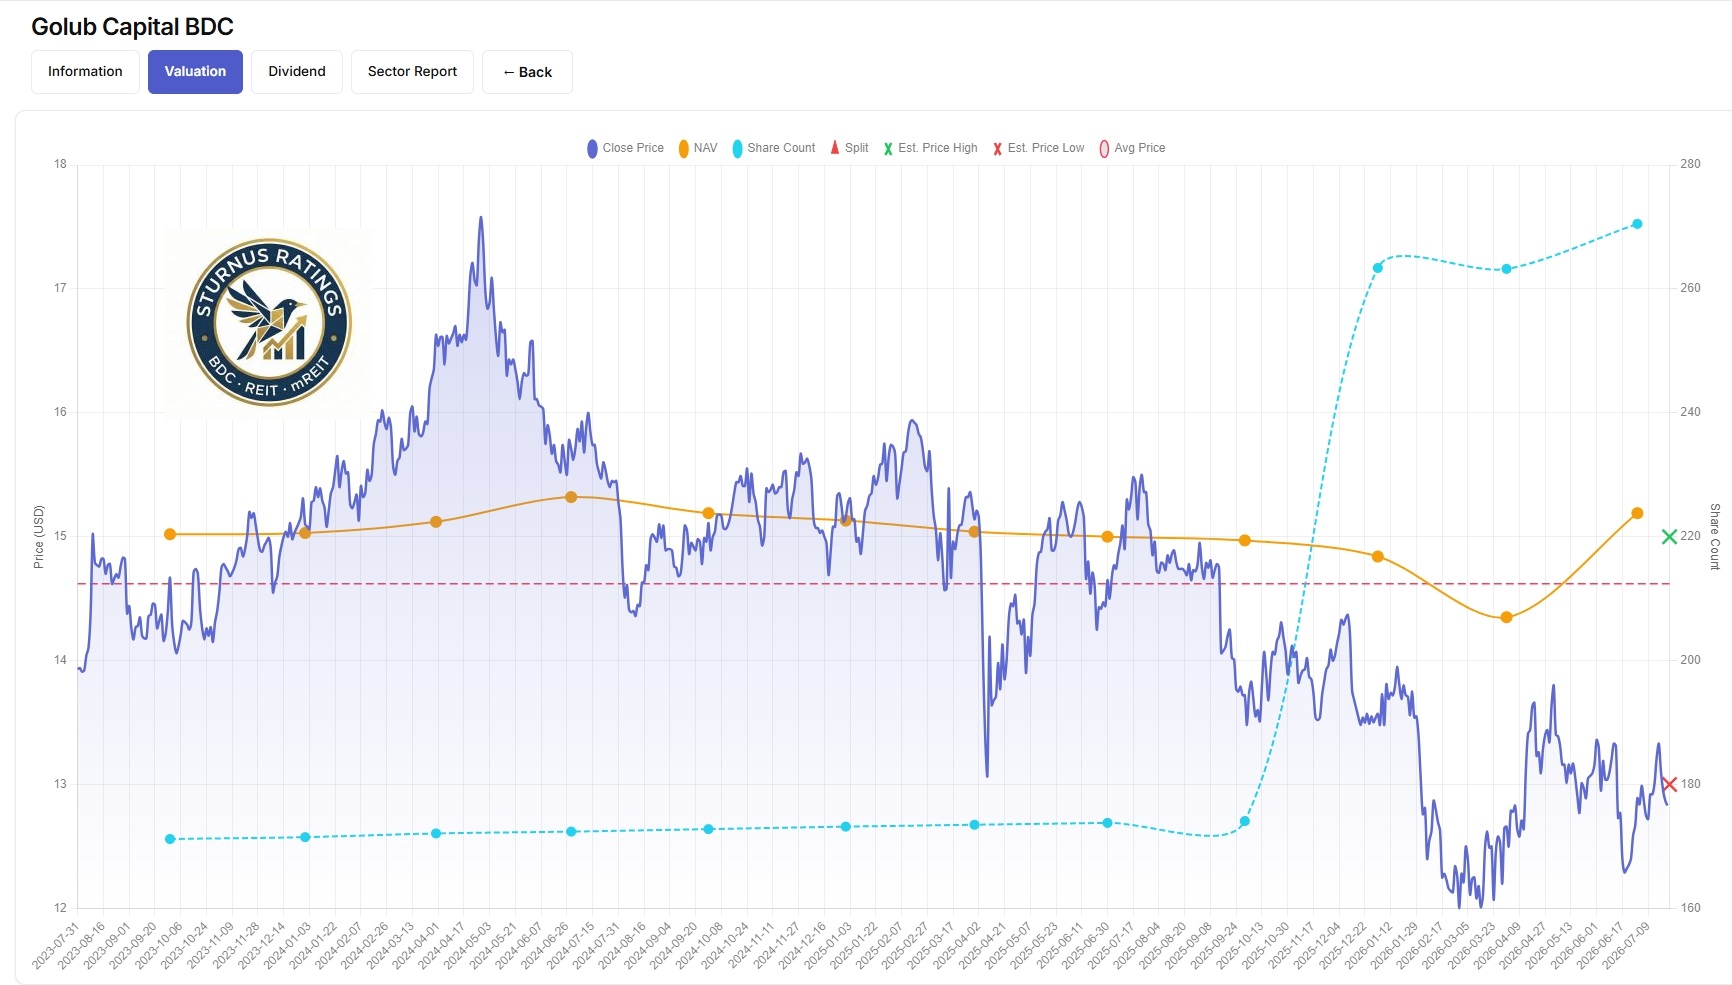
Golub Capital BDC, Inc. traded at $12.78 to $12.88 per share as of early August 2026, recovering modestly from its 52-week low of $11.77 while remaining well below its 52-week high of $15.42. Over the trailing 12-month period, share price performance has faced headwinds following credit spread compression, quarterly unrealized fair value write-downs, and the base quarterly dividend adjustment from $0.39 per share in late FY2025 to $0.33 per share in FY2026.
Share Price Performance Relative to NAV Trends
Golub Capital BDC, Inc. reported a Net Asset Value (NAV) per share of $14.25 as of June 30, 2026 (Q3 FY2026), compared to $14.35 as of March 31, 2026, and $14.84 as of December 31, 2025. The decline in NAV per share across FY2026 has been predominantly driven by mark-to-market fair value adjustments and spread widening rather than permanent capital impairment. While NAV per share contracted by ~$0.10 quarter-over-quarter in Q3 FY2026, the share price has experienced a sharper contraction, widening the market price discount relative to underlying book value.
Price-to-NAV (P/NAV) Ratio Analysis
At a market price of $12.78 relative to the Q3 FY2026 NAV per share of $14.25, Golub Capital BDC, Inc. trades at a Price-to-NAV ratio of approximately 0.90x (a 10.3% discount to NAV).
Comparison with Historical Valuation Ranges
Historically, Golub Capital BDC, Inc. has traded near parity with NAV (1.00x P/NAV) or at a modest premium (1.02x–1.08x) during benign credit environments, supported by its premier sponsor-backed first-lien lending strategy and historically low credit default record. The current 0.90x P/NAV multiple places the stock near the lower end of its historical valuation corridor, reflecting broader market anxiety over private credit spread compression, software portfolio exposure, and interest rate easing by the Federal Reserve.
Comparison with Relevant BDC Peers
While top-tier internally managed peer Main Street Capital Corporation trades at a significant premium (~1.60x P/NAV) and Ares Capital Corporation trades slightly above book value (~1.05x P/NAV), Golub Capital BDC, Inc. trades at a notable discount alongside externally managed upper-middle-market direct lending peers.
Market Sentiment and Investor Expectations
Investor sentiment toward Golub Capital BDC, Inc. is cautious but stabilizing. Market expectations focus heavily on management's ability to navigate potential credit risks—specifically within software portfolio companies flagged for potential disruption—while stabilizing NAV per share and maintaining NII coverage for the reset $0.33 per share quarterly base dividend.
Key Catalysts Affecting Share Price Performance
- Stabilization of Fair Value Marks: Moderation or reversal of mark-to-market unrealized losses on high-performing loans (IPR 4/5 categories).
- M&A and Refinancing Activity: Acceleration in sponsor-backed transaction activity driving origination fees and prepayment exit premiums.
- Federal Reserve Easing Trajectory: Pace and depth of Fed rate cuts impacting portfolio yields versus borrowing costs.
Dividend
Current Dividend Yield
Based on the declared regular quarterly cash distribution of $0.33 per share ($1.32 annualized) and a share price of $12.78, Golub Capital BDC, Inc. provides a forward regular dividend yield of 10.33%.
Regular, Supplemental, and Special Dividend History
Following a period of elevated distributions in FY2024–FY2025 (which included $0.39 base dividends and periodic supplemental distributions), Golub Capital BDC, Inc. recalibrated its base distribution to $0.33 per share in early FY2026 to align with lower base interest rates and normalized portfolio spreads.
NII and Adjusted NII Coverage Analysis
For Q3 FY2026 (quarter ended June 30, 2026), Golub Capital BDC, Inc. generated GAAP Net Investment Income (NII) per share of $0.33 and Adjusted NII per share of $0.34 (which excludes $0.01 per share of purchase premium amortization from the GCIC/GBDC 3 acquisitions).
Dividend Payout Ratio
The payout ratio relative to Q3 FY2026 Adjusted NII stands at 97.1% ($0.33 / $0.34), reflecting a tight but positive earning cushion over the base dividend.
Spillover Income Analysis
Golub Capital BDC, Inc. maintains substantial cumulative undistributed taxable income (spillover income) carried over from strong earnings quarters in FY2024 and FY2025. This spillover reserve provides a significant liquidity buffer to support base dividend continuity during periods of transient earning pressure.
Assessment of Dividend Safety and Sustainability
The dividend safety of Golub Capital BDC, Inc. is assessed as Moderate to High. Key factors supporting the $0.33 quarterly rate include:
- Fully Covered Base Payout: Adjusted NII ($0.34) fully covers the $0.33 distribution.
- First-Lien Focus: 85%+ of portfolio investments are senior secured first-lien debt, generating reliable contractual cash interest.
- Decreasing Funding Costs: Floating-rate liabilities enable interest expense reductions alongside benchmark rate declines.
Potential Catalysts for Dividend Increases or Reductions
- Upward Catalysts: Re-acceleration in private equity deal volume, higher prepayment fees, and stable short-term base rates.
- Downward Catalysts: Federal Reserve benchmark rate cuts reducing SOFR below 3.50% combined with additional credit non-accruals.
Management's Dividend Outlook
Management framed the $0.33 per share distribution as a sustainable base level designed to withstand a normalizing interest rate environment while preserving capital and flexibility.
Valuation
Golub Capital BDC, Inc. trades at 0.90x P/NAV ($12.78 price vs. $14.25 NAVPS). The 10.3% discount reflects market discounting of private credit fair value marks and economic cycle risks.
Historical Price-to-NAV Comparison
Over the past five years, Golub Capital BDC, Inc. has typically traded between 0.95x and 1.05x NAV. The current 0.90x multiple represents an attractive entry point relative to historical valuation norms.
NAV Per Share Trend Analysis
- Q1 FY2026 (Dec 31, 2025): $14.84
- Q2 FY2026 (Mar 31, 2026): $14.35 (-$0.49 QoQ)
- Q3 FY2026 (Jun 30, 2026): $14.25 (-$0.10 QoQ)
The rate of NAV contraction slowed substantially in Q3 FY2026 (-$0.10 vs -$0.49 in Q2 FY2026). The majority of unrealized losses stem from credit spread widening rather than realized capital write-offs.
Net Investment Income Trend Analysis
Total investment income for Q3 FY2026 reflected lower benchmark yields, but operational scale following the GBDC 3 acquisition supported robust NII generation of $0.33 GAAP / $0.34 Adjusted per share, matching Q2 FY2026 performance.
Portfolio Yield and Earnings Quality Assessment
- Investment Income Yield: ~9.7% annualized (down ~30 bps QoQ).
- Cost of Debt: ~5.2% (down ~20 bps QoQ due to floating-rate debt structures).
- Weighted Average Net Spread: Slightly compressed, but offset by disciplined fee collection and scale efficiencies.
Non-Accrual Analysis and Credit Quality Evaluation
As of June 30, 2026 (Q3 FY2026), Golub Capital BDC, Inc. reported:
- Non-Accrual Rate at Fair Value: 1.4% of total investments.
- Internal Performance Ratings: Approximately 89% of the portfolio remains in the highest performing categories (IPR 4 and IPR 5).
Non-accruals remain low relative to BDC industry peers, demonstrating effective risk management within middle-market lending.
Portfolio Composition and Diversification Analysis
- Total Portfolio Fair Value: ~$8.20 billion across ~380+ portfolio companies.
- Asset Class Mix: Dominated by First-Lien Senior Secured debt (~86%–90%), with secondary exposure to Junior Debt and Equity co-investments.
- Software Portfolio Exposure: Management noted ~8% of the software portfolio carries elevated risk considerations due to rapid AI development, but emphasized granular diversification and high borrower gross margins.
Leverage and Balance Sheet Assessment
- GAAP Debt-to-Equity Ratio: ~1.25x.
- Regulatory Leverage: Aligned within the company's target operating range of 1.15x–1.25x, leaving comfortable head-room below the statutory 2.0x limit.
Liquidity and Debt Maturity Profile
Golub Capital BDC, Inc. maintains strong liquidity through available cash, undrawn revolving credit capacity, and recent credit facility amendments (including extending its JPMorgan-led senior secured revolving credit facility to 2029 and issuing $500M institutional notes due 2031).
Impact of Federal Reserve Policy and Macroeconomic Conditions
With floating-rate assets matching ~80% floating-rate liabilities, Golub Capital BDC, Inc. experiences synchronized rate adjustments. While lower SOFR compresses asset yield, interest rate floors and falling interest expenses cushion net margin compression.
Assessment of Valuation
Golub Capital BDC, Inc. appears Undervalued at 0.90x NAV. Given its high first-lien portfolio concentration, low non-accrual rate (1.4% FV), fully covered 10.3% yield, and backing by GC Advisors LLC, the current 10% discount to book value provides an attractive risk-adjusted entry point.
Conclusion
Summary of Key Strengths
- High First-Lien Senior Secured Focus: ~90% first-lien debt structure minimizes capital loss severity.
- Covered Dividend: Q3 FY2026 Adjusted NII ($0.34) fully covers the $0.33 regular distribution.
- Low Non-Accruals: 1.4% non-accrual rate at fair value demonstrates underwriting discipline.
- Scale and Liquidity: $8.2 billion investment portfolio with extended debt maturity profiles out to 2029–2031.
Summary of Key Risks
- Software Industry Disruptions: Tech sector shift requires monitoring of the ~8% software exposure flagged for elevated AI risk.
- Benchmark Rate Cuts: Monetary easing by the Fed puts pressure on total investment income yield.
- Recent NAV Depreciation: Mark-to-market spread widening created NAV pressure in early FY2026.
Outlook for NAV and Net Investment Income
The trajectory for NAV per share is expected to stabilize near $14.20–$14.35 as credit spread volatility moderates. Adjusted NII per share is projected to range between $0.33 and $0.35 over coming quarters, matching base distribution demands.
Outlook for Dividend Sustainability
Golub Capital BDC, Inc. demonstrates High base dividend sustainability at the $0.33 quarterly rate ($1.32 annualized), supported by covered earnings and cumulative spillover reserves.
Assessment of Portfolio Credit Quality
Portfolio credit quality remains Solid, with 89% of investments performing in top internal rating brackets and non-accruals limited to 1.4% at fair value.
Expected Impact of Management Guidance and Federal Reserve Policy
Management's proactive debt refinancing and cost controls position Golub Capital BDC, Inc. to absorb Fed rate cuts while sustaining net investment spreads.
Investment Thesis
Golub Capital BDC, Inc. presents a compelling income and value opportunity. At a 0.90x P/NAV valuation, the market price over-discounts temporary mark-to-market NAV adjustments while under-crediting its senior secured portfolio, strong liquidity, and covered 10.3% yield.
Comments (0)
Log in to leave a comment.
No comments yet. Be the first to comment!